Answered step by step
Verified Expert Solution
Question
1 Approved Answer
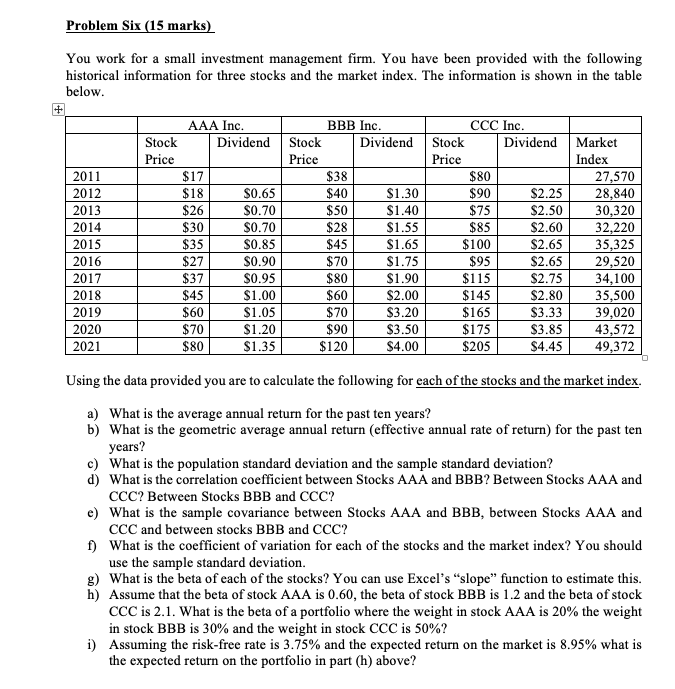
use excel please You work for a small investment management firm. You have been provided with the following historical information for three stocks and the

use excel please
You work for a small investment management firm. You have been provided with the following historical information for three stocks and the market index. The information is shown in the table below. Using the data provided you are to calculate the following for each of the stocks and the market index. a) What is the average annual return for the past ten years? b) What is the geometric average annual return (effective annual rate of return) for the past ten years? c) What is the population standard deviation and the sample standard deviation? d) What is the correlation coefficient between Stocks AAA and BBB? Between Stocks AAA and CCC? Between Stocks BBB and CCC? e) What is the sample covariance between Stocks AAA and BBB, between Stocks AAA and CCC and between stocks BBB and CCC? f) What is the coefficient of variation for each of the stocks and the market index? You should use the sample standard deviation. g) What is the beta of each of the stocks? You can use Excel's "slope" function to estimate this. h) Assume that the beta of stock AAA is 0.60, the beta of stock BBB is 1.2 and the beta of stock CCC is 2.1. What is the beta of a portfolio where the weight in stock AAA is 20% the weight in stock BBB is 30% and the weight in stock CCC is 50% ? i) Assuming the risk-free rate is 3.75% and the expected return on the market is 8.95% what is the expected return on the portfolio in part (h) aboveStep by Step Solution
There are 3 Steps involved in it
Step: 1

Get Instant Access to Expert-Tailored Solutions
See step-by-step solutions with expert insights and AI powered tools for academic success
Step: 2

Step: 3

Ace Your Homework with AI
Get the answers you need in no time with our AI-driven, step-by-step assistance
Get Started


