
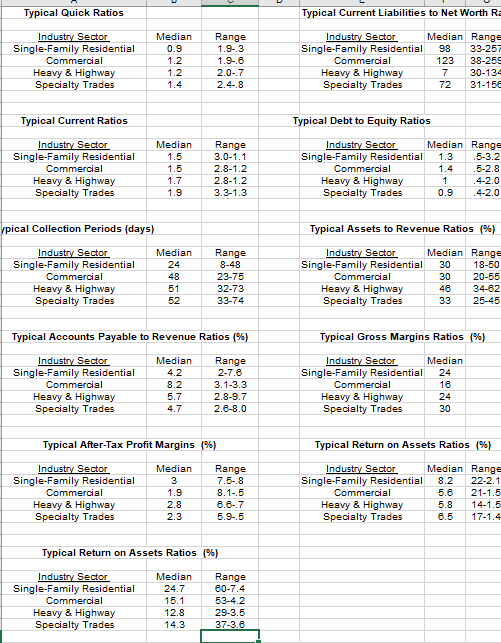
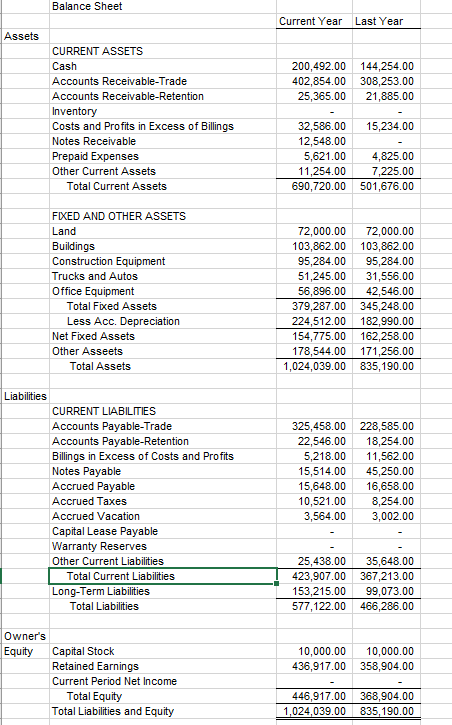
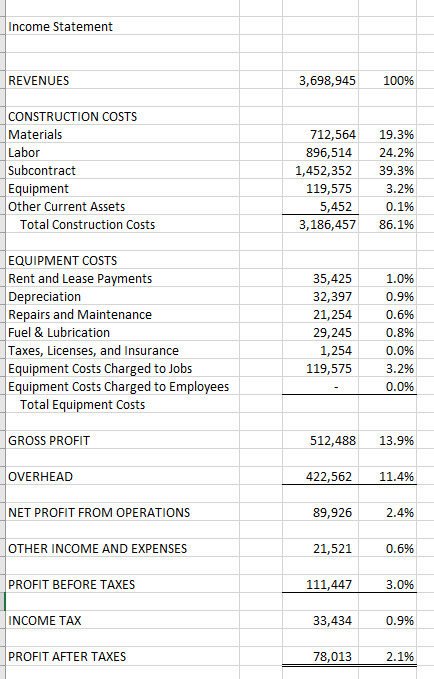
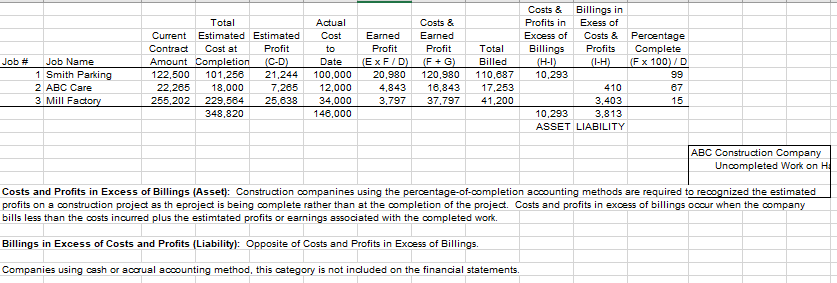
Use financial statements within the provided Excel file to provide the answer for the following financial ratios: 1. Return on Assets 2. Return on Equity 3. Months of Backlog Summary of T-Accounts Showing Transactions for a period Assets Increases Drecreases (C) Liabilities Decreases (D Increases (C) Shareholder's Equity Decreases D Increases 1 1 $100,000.00 2 $ 60,000.00 1 3 Purchase Equipment with Cash Purchase Material on Credit Pay Cash to Supplier Pay Insurane Premium in Advance $ 600.00 Receive Cash from Customer in Advan $ 3.000.00 $ $ 8,000.00 600.00 $ 8,000.00 4 1 5 $ 3.000.00 $ 55,000.00 3 Basic Questions to Ask 1. Which Accoutns are affected by the transaction? 2. Should those accounts be increased or decreased? 3. How is the transaction recorded using debits or credits? Accounting Journal Entry Rules: Debits Credits 1 1 Purchase Equipment Cash Account (Asset) Increases Decreases (C) $ 100,000.00 + . Assets Liabilities Revenues- Equity - (Contra Asset) Balance Equipment (Asset) Increases Decreases (C) 1 2 Puchase Material on Credit Cash Account (Asset) Increases Decreases (C) Balance Liability Decreases (Increases (C) 1 3 Pay Cash to Supplier Cash Account (Asset) Increases Decreases (C) Balance Accounts Payable (Liability Decreases (Increases (C) Typical Quick Ratios Typical Current Liabilities to Net Worth R: Median Range Industry Sector Single-Family Residential Commercial Heavy & Highway Specialty Trades Industry Sector Median Range Single-Family Residential 98 33-251 Commercial 112338-259 Heavy & Highway 7 30-134 Specialty Trades 72 31-15 20-7 2.4.8 Typical Current Ratios Typical Debt to Equity Ratios Industry Sector Single-Family Residential Commercial Heavy & Highway Specialty Trades Median 1.5 15 Range 3.0-1.1 2.8-1.2 2.8-1.2 3.3-1.3 Industry Sector Median Range Single-Family Residential 1.3 .5-3.2 Commercial 1.4 .5-2.8 Heavy & Highway 1 .4-2.0 Specialty Trades 0.9 .4-2.0 1.7 1.9 Vpical Collection Periods (days) Typical Assets to Revenue Ratios (%) Industry Sector Single-Family Residential Commercial Heavy & Highway Specialty Trades Median 24 48 Range 8-48 23-75 32-73 33-74 Industry Sector Median Range Single-Family Residential 30 18-50 Commercial 30 20-55 Heavy & Highway 46 34-62 Specialty Trades 33 25-45 52 Typical Accounts Payable to Revenue Ratios (%) Typical Gross Margins Ratios (%) Industry Sector Single-Family Residential Commercial Heavy & Highway Specialty Trades Median 4.2 8.2 Range 2-7.6 3.1-3.3 2.8-9.7 2.6-8.0 Industry Sector Median Single-Family Residential 24 Commercial Heavy & Highway Specialty Trades 30 5.7 4.7 Typical After-Tax Profit Margins (%) Typical Return on Assets Ratios (%) Industry Sector Single-Family Residential Commercial Heavy & Highway Specialty Trades Median 3 1.9 2.8 23 Range 7.5-.8 8.1-5 6.6-7 5.95 Industry Sector Median Range Single-Family Residential 8.2 22-2.1 Commercial 5.6 21-1.5 Heavy & Highway 5.8 14-1.5 Specialty Trades 6.5 17-1.4 Typical Return on Assets Ratios (%) Industry Sector Single-Family Residential Commercial Heavy & Highway Specialty Trades Median 24.7 15.1 12.8 14.3 Range 60-7.4 53-42 29-3.5 37-3.6 Balance Sheet Current Year Last Year Assets 200,492.00 402,854.00 25.365.00 144,254.00 308,253.00 21,885.00 CURRENT ASSETS Cash Accounts Receivable-Trade Accounts Receivable-Retention Inventory Costs and Profits in Excess of Billings Notes Receivable Prepaid Expenses Other Current Assets Total Current Assets 15,234.00 32,586.00 12.548.00 5,621.00 11,254.00 690,720.00 4,825.00 7,225.00 501,676.00 FIXED AND OTHER ASSETS Land Buildings Construction Equipment Trucks and Autos Office Equipment Total Fixed Assets Less Acc. Depreciation Net Fixed Assets Other Asseets Total Assets 72,000.00 103,862.00 95,284.00 51,245.00 56,896.00 379,287.00 224,512.00 154,775.00 178,544.00 1,024,039.00 72,000.00 103,862.00 95,284.00 31,556.00 42,546.00 345,248.00 182,990.00 162,258.00 171,256.00 835,190.00 Liabilities CURRENT LIABILITIES Accounts Payable-Trade Accounts Payable-Retention Billings in Excess of Costs and Profits Notes Payable Accrued Payable Accrued Taxes Accrued Vacation Capital Lease Payable Warranty Reserves Other Current Liabilities Total Current Liabilities Long-Term Liabilities Total Liabilities 325,458.00 22,546.00 5,218.00 15,514.00 15,648.00 10,521.00 3,564.00 228,585.00 18,254.00 11,562.00 45,250.00 16,658.00 8,254.00 3,002.00 25,438.00 423,907.00 153.215.00 577,122.00 35,648.00 367,213.00 99,073.00 466,286.00 10,000.00 436,917.00 10,000.00 358,904.00 Owner's Equity Capital Stock Retained Earnings Current Period Net Income Total Equity Total Liabilities and Equity 446,917.00 1,024,039.00 368,904.00 835,190.00 Income Statement REVENUES 3,698,945 100% CONSTRUCTION COSTS Materials Labor Subcontract Equipment Other Current Assets Total Construction Costs 712,564 896,514 1,452,352 19.3% 24.2% 39.3% 3.2% 0.1% 86.1% 5,452 3,186,457 EQUIPMENT COSTS Rent and Lease Payments Depreciation Repairs and Maintenance Fuel & Lubrication Taxes, Licenses, and Insurance Equipment Costs Charged to Jobs Equipment Costs Charged to Employees Total Equipment Costs 35,425 32,397 21,254 29,245 1,254 119,575 1.0% 0.9% 0.6% 0.8% 0.0% 3.2% 0.0% GROSS PROFIT 512,488 13.9% OVERHEAD 422,562 11.4% NET PROFIT FROM OPERATIONS 89,926 2.4% OTHER INCOME AND EXPENSES 21,521 0.6% PROFIT BEFORE TAXES 111,447 3.0% INCOME TAX 33,434 0.9% PROFIT AFTER TAXES 78,013 2.1% Percentage Complete (F x 100) / D Job # Total Current Estimated Estimated Contract Cost at Profit Amount Completion (C-D) 122.500 122,500 101,256 101,290 21,244 22,265 18,000 7,265 255,202 229,564 25,638 348,820 Job Name 1 Smith Parking 2 ABC Care 3 Mill Factory Actual Cost to Date 100,000 12,000 34,000 146,000 Costs & Earned Earned Profit Profit (ExF/D) (F+G) 20,980120,980 4,843 16,843 3,797 37,797 Total Billed 110,687 17,253 41,200 Costs & Billings in Profits in Exess of Excess of Costs & Billings Profits (HI) (I-H) 10,293 410 3,403 10,293 3,813 ASSET LIABILITY 99 87 15 ABC Construction Company Uncompleted Work on H Costs and Profits in Excess of Billings (Asset): Construction companines using the percentage-of-completion accounting methods are required to recognized the estimated profits on a construction project as theproject is being complete rather than at the completion of the project. Costs and profits in excess of billings occur when the company bills less than the costs incurred plus the estimtated profits or earnings associated with the completed work. Billings in Excess of Costs and Profits (Liability): Opposite of Costs and Profits in Excess of Billings Companies using cash or accrual accounting method, this category is not included on the financial statements Use financial statements within the provided Excel file to provide the answer for the following financial ratios: 1. Return on Assets 2. Return on Equity 3. Months of Backlog Summary of T-Accounts Showing Transactions for a period Assets Increases Drecreases (C) Liabilities Decreases (D Increases (C) Shareholder's Equity Decreases D Increases 1 1 $100,000.00 2 $ 60,000.00 1 3 Purchase Equipment with Cash Purchase Material on Credit Pay Cash to Supplier Pay Insurane Premium in Advance $ 600.00 Receive Cash from Customer in Advan $ 3.000.00 $ $ 8,000.00 600.00 $ 8,000.00 4 1 5 $ 3.000.00 $ 55,000.00 3 Basic Questions to Ask 1. Which Accoutns are affected by the transaction? 2. Should those accounts be increased or decreased? 3. How is the transaction recorded using debits or credits? Accounting Journal Entry Rules: Debits Credits 1 1 Purchase Equipment Cash Account (Asset) Increases Decreases (C) $ 100,000.00 + . Assets Liabilities Revenues- Equity - (Contra Asset) Balance Equipment (Asset) Increases Decreases (C) 1 2 Puchase Material on Credit Cash Account (Asset) Increases Decreases (C) Balance Liability Decreases (Increases (C) 1 3 Pay Cash to Supplier Cash Account (Asset) Increases Decreases (C) Balance Accounts Payable (Liability Decreases (Increases (C) Typical Quick Ratios Typical Current Liabilities to Net Worth R: Median Range Industry Sector Single-Family Residential Commercial Heavy & Highway Specialty Trades Industry Sector Median Range Single-Family Residential 98 33-251 Commercial 112338-259 Heavy & Highway 7 30-134 Specialty Trades 72 31-15 20-7 2.4.8 Typical Current Ratios Typical Debt to Equity Ratios Industry Sector Single-Family Residential Commercial Heavy & Highway Specialty Trades Median 1.5 15 Range 3.0-1.1 2.8-1.2 2.8-1.2 3.3-1.3 Industry Sector Median Range Single-Family Residential 1.3 .5-3.2 Commercial 1.4 .5-2.8 Heavy & Highway 1 .4-2.0 Specialty Trades 0.9 .4-2.0 1.7 1.9 Vpical Collection Periods (days) Typical Assets to Revenue Ratios (%) Industry Sector Single-Family Residential Commercial Heavy & Highway Specialty Trades Median 24 48 Range 8-48 23-75 32-73 33-74 Industry Sector Median Range Single-Family Residential 30 18-50 Commercial 30 20-55 Heavy & Highway 46 34-62 Specialty Trades 33 25-45 52 Typical Accounts Payable to Revenue Ratios (%) Typical Gross Margins Ratios (%) Industry Sector Single-Family Residential Commercial Heavy & Highway Specialty Trades Median 4.2 8.2 Range 2-7.6 3.1-3.3 2.8-9.7 2.6-8.0 Industry Sector Median Single-Family Residential 24 Commercial Heavy & Highway Specialty Trades 30 5.7 4.7 Typical After-Tax Profit Margins (%) Typical Return on Assets Ratios (%) Industry Sector Single-Family Residential Commercial Heavy & Highway Specialty Trades Median 3 1.9 2.8 23 Range 7.5-.8 8.1-5 6.6-7 5.95 Industry Sector Median Range Single-Family Residential 8.2 22-2.1 Commercial 5.6 21-1.5 Heavy & Highway 5.8 14-1.5 Specialty Trades 6.5 17-1.4 Typical Return on Assets Ratios (%) Industry Sector Single-Family Residential Commercial Heavy & Highway Specialty Trades Median 24.7 15.1 12.8 14.3 Range 60-7.4 53-42 29-3.5 37-3.6 Balance Sheet Current Year Last Year Assets 200,492.00 402,854.00 25.365.00 144,254.00 308,253.00 21,885.00 CURRENT ASSETS Cash Accounts Receivable-Trade Accounts Receivable-Retention Inventory Costs and Profits in Excess of Billings Notes Receivable Prepaid Expenses Other Current Assets Total Current Assets 15,234.00 32,586.00 12.548.00 5,621.00 11,254.00 690,720.00 4,825.00 7,225.00 501,676.00 FIXED AND OTHER ASSETS Land Buildings Construction Equipment Trucks and Autos Office Equipment Total Fixed Assets Less Acc. Depreciation Net Fixed Assets Other Asseets Total Assets 72,000.00 103,862.00 95,284.00 51,245.00 56,896.00 379,287.00 224,512.00 154,775.00 178,544.00 1,024,039.00 72,000.00 103,862.00 95,284.00 31,556.00 42,546.00 345,248.00 182,990.00 162,258.00 171,256.00 835,190.00 Liabilities CURRENT LIABILITIES Accounts Payable-Trade Accounts Payable-Retention Billings in Excess of Costs and Profits Notes Payable Accrued Payable Accrued Taxes Accrued Vacation Capital Lease Payable Warranty Reserves Other Current Liabilities Total Current Liabilities Long-Term Liabilities Total Liabilities 325,458.00 22,546.00 5,218.00 15,514.00 15,648.00 10,521.00 3,564.00 228,585.00 18,254.00 11,562.00 45,250.00 16,658.00 8,254.00 3,002.00 25,438.00 423,907.00 153.215.00 577,122.00 35,648.00 367,213.00 99,073.00 466,286.00 10,000.00 436,917.00 10,000.00 358,904.00 Owner's Equity Capital Stock Retained Earnings Current Period Net Income Total Equity Total Liabilities and Equity 446,917.00 1,024,039.00 368,904.00 835,190.00 Income Statement REVENUES 3,698,945 100% CONSTRUCTION COSTS Materials Labor Subcontract Equipment Other Current Assets Total Construction Costs 712,564 896,514 1,452,352 19.3% 24.2% 39.3% 3.2% 0.1% 86.1% 5,452 3,186,457 EQUIPMENT COSTS Rent and Lease Payments Depreciation Repairs and Maintenance Fuel & Lubrication Taxes, Licenses, and Insurance Equipment Costs Charged to Jobs Equipment Costs Charged to Employees Total Equipment Costs 35,425 32,397 21,254 29,245 1,254 119,575 1.0% 0.9% 0.6% 0.8% 0.0% 3.2% 0.0% GROSS PROFIT 512,488 13.9% OVERHEAD 422,562 11.4% NET PROFIT FROM OPERATIONS 89,926 2.4% OTHER INCOME AND EXPENSES 21,521 0.6% PROFIT BEFORE TAXES 111,447 3.0% INCOME TAX 33,434 0.9% PROFIT AFTER TAXES 78,013 2.1% Percentage Complete (F x 100) / D Job # Total Current Estimated Estimated Contract Cost at Profit Amount Completion (C-D) 122.500 122,500 101,256 101,290 21,244 22,265 18,000 7,265 255,202 229,564 25,638 348,820 Job Name 1 Smith Parking 2 ABC Care 3 Mill Factory Actual Cost to Date 100,000 12,000 34,000 146,000 Costs & Earned Earned Profit Profit (ExF/D) (F+G) 20,980120,980 4,843 16,843 3,797 37,797 Total Billed 110,687 17,253 41,200 Costs & Billings in Profits in Exess of Excess of Costs & Billings Profits (HI) (I-H) 10,293 410 3,403 10,293 3,813 ASSET LIABILITY 99 87 15 ABC Construction Company Uncompleted Work on H Costs and Profits in Excess of Billings (Asset): Construction companines using the percentage-of-completion accounting methods are required to recognized the estimated profits on a construction project as theproject is being complete rather than at the completion of the project. Costs and profits in excess of billings occur when the company bills less than the costs incurred plus the estimtated profits or earnings associated with the completed work. Billings in Excess of Costs and Profits (Liability): Opposite of Costs and Profits in Excess of Billings Companies using cash or accrual accounting method, this category is not included on the financial statements


