

Answered step by step
Verified Expert Solution
Question
1 Approved Answer
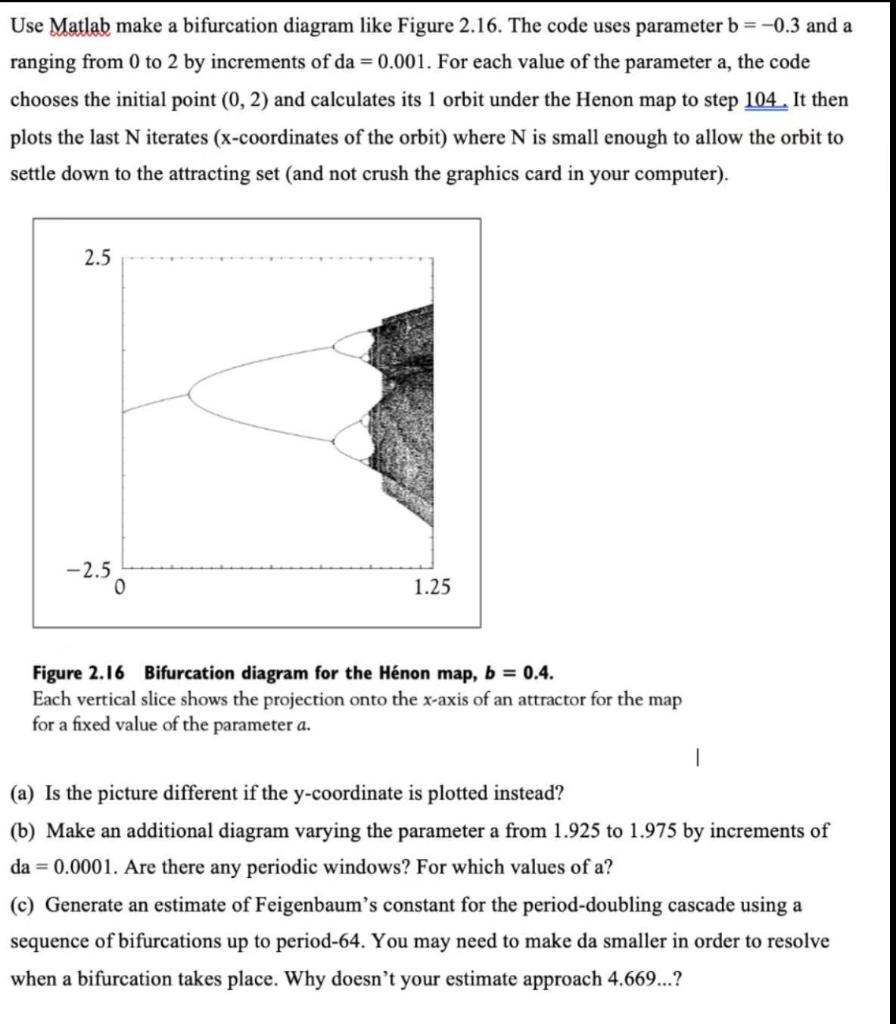
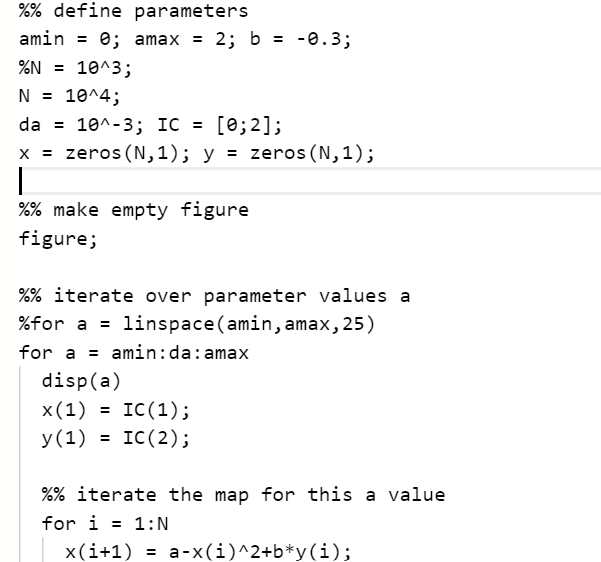
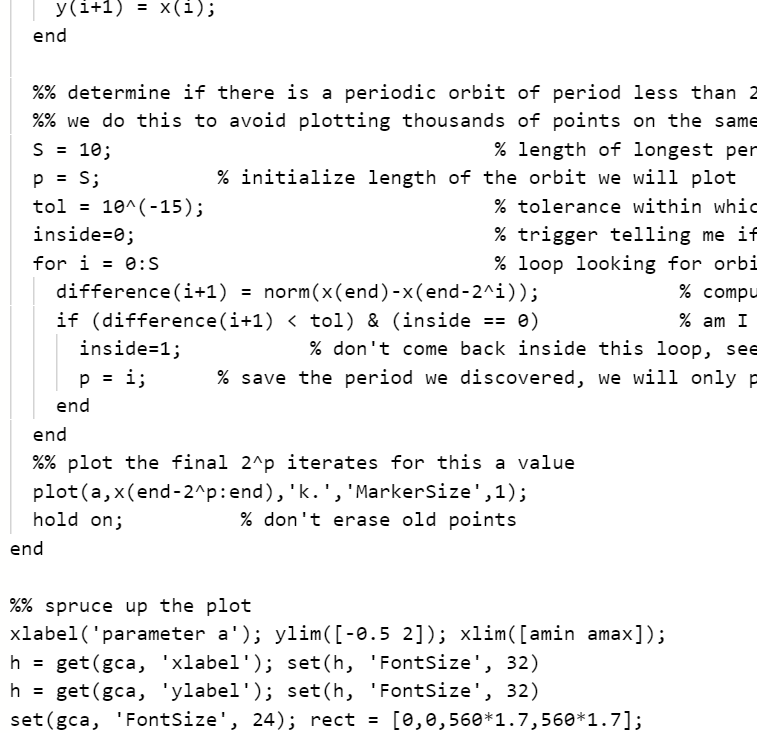
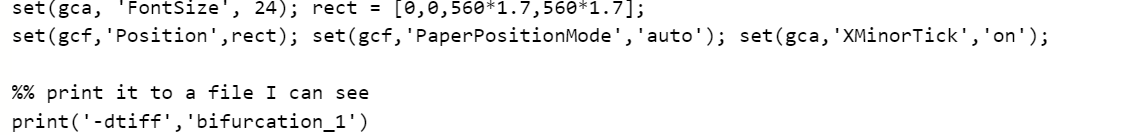
Use Matlab make a bifurcation diagram like Figure 2.16. The code uses parameter b=-0.3 and a ranging from 0 to 2 by increments of da
Step by Step Solution
There are 3 Steps involved in it
Step: 1

Get Instant Access to Expert-Tailored Solutions
See step-by-step solutions with expert insights and AI powered tools for academic success
Step: 2

Step: 3
Ace Your Homework with AI
Get the answers you need in no time with our AI-driven, step-by-step assistance
Get Started
Select Healthcare Classification Systems And Databases
Authors: Katherine S. Rowell, Ann Cutrell
1st Edition
0615909760, 978-0615909769