Use matlab to answer the following questions and upload all matlab work please (Beginner level )
ONLY POST WORK DIRECTLY FROM MATLAB

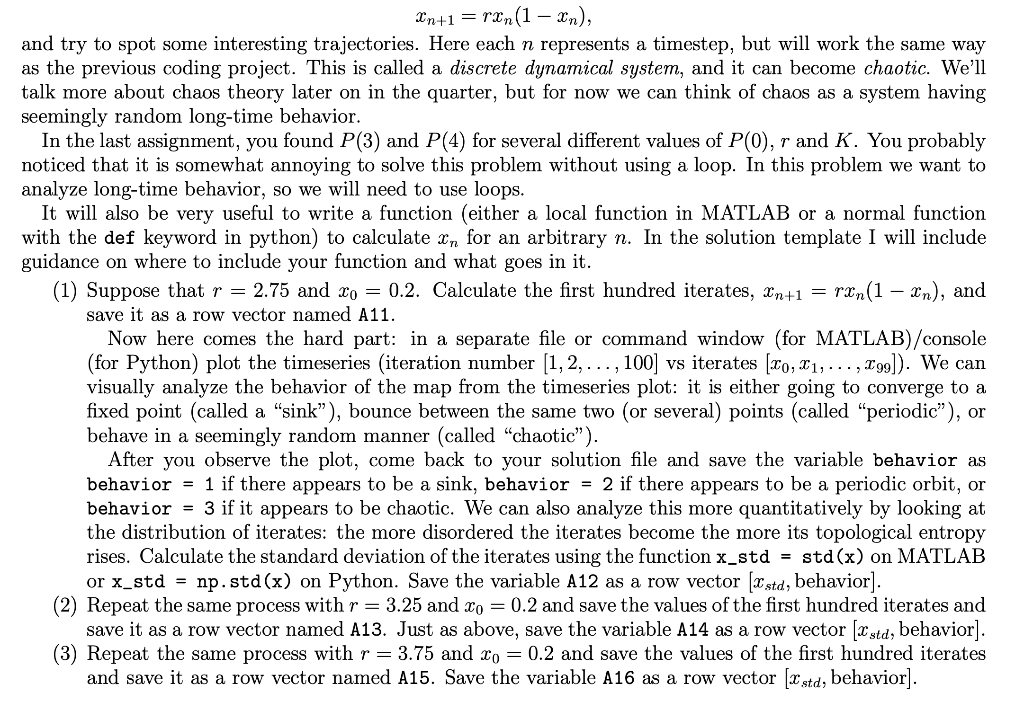
Xn), and Ln+1 = rxn(1 Xn), and try to spot some interesting trajectories. Here each n represents a timestep, but will work the same way as the previous coding project. This is called a discrete dynamical system, and it can become chaotic. We'll talk more about chaos theory later on in the quarter, but for now we can think of chaos as a system having seemingly random long-time behavior. In the last assignment, you found P(3) and P(4) for several different values of P(0), r and K. You probably noticed that it is somewhat annoying to solve this problem without using a loop. In this problem we want to analyze long-time behavior, so we will need to use loops. It will also be very useful to write a function (either a local function in MATLAB or a normal function with the def keyword in python) to calculate xn for an arbitrary n. In the solution template I will include guidance on where to include your function and what goes in it. (1) Suppose that r = 2.75 and Xo = 0.2. Calculate the first hundred iterates, Xn+1 = rxn(1 save it as a row vector named A11. Now here comes the hard part: in a separate file or command window (for MATLAB)/console (for Python) plot the timeseries (iteration number [1, 2, ..., 100) vs iterates (10, 21, ... , 199]). We can visually analyze the behavior of the map from the timeseries plot: it is either going to converge to a fixed point (called a "sink), bounce between the same two (or several) points (called periodic), or behave in a seemingly random manner (called "chaotic"). After you observe the plot, come back to your solution file and save the variable behavior as behavior = 1 if there appears to be a sink, behavior = 2 if there appears to be a periodic orbit, or behavior = 3 if it appears to be chaotic. We can also analyze this more quantitatively by looking at the distribution of iterates: the more disordered the iterates become the more its topological entropy rises. Calculate the standard deviation of the iterates using the function x_std = std(x) on MATLAB or x_std = np. std(x) on Python. Save the variable A12 as a row vector (Ista, behavior). (2) Repeat the same process with r = 3.25 and Xo = 0.2 and save the values of the first hundred iterates and save it as a row vector named A13. Just as above, save the variable A14 as a row vector (2 std, behavior). (3) Repeat the same process with r = 3.75 and X, = 0.2 and save the values of the first hundred iterates and save it as a row vector named A15. Save the variable A16 as a row vector [2 std, behavior)


