

Question
Use Microsoft Excel (Solver) to solve this question. Eastinghouse sells air conditioners. The annual demand for air conditioners in each region of the country is
Use Microsoft Excel (Solver) to solve this question.
Eastinghouse sells air conditioners. The annual demand for air conditioners in each region of the country is as follows: East, 100,000; South, 150,000; Midwest, 110,000; and West, 90,000. Eastinghouse is considering building its air conditioners in four different cities: New York, Atlanta, Chicago, and Los Angeles. The cost of producing an air conditioner in a city and shipping it to a region of the country is given in the excel template file. Any factory can produce up to 150,000 air conditioners per year. The annual fixed cost of operating a factory in each city is given in the same file. At least 50,000 units of the Midwest demand for air conditioners must come from New York, and at least 50,000 units of the Midwest demand must come from Atlanta. Determine how Eastinghouse can minimize the annual cost of meeting demand for air conditioners.
The Excel model is given below. Please solve this showing all the formulas, calculations, and filling in all missing information using Solver in Microsoft Excel.
Will like the answer if the question is fully answered along with Excel screenshots for formulas and answers.
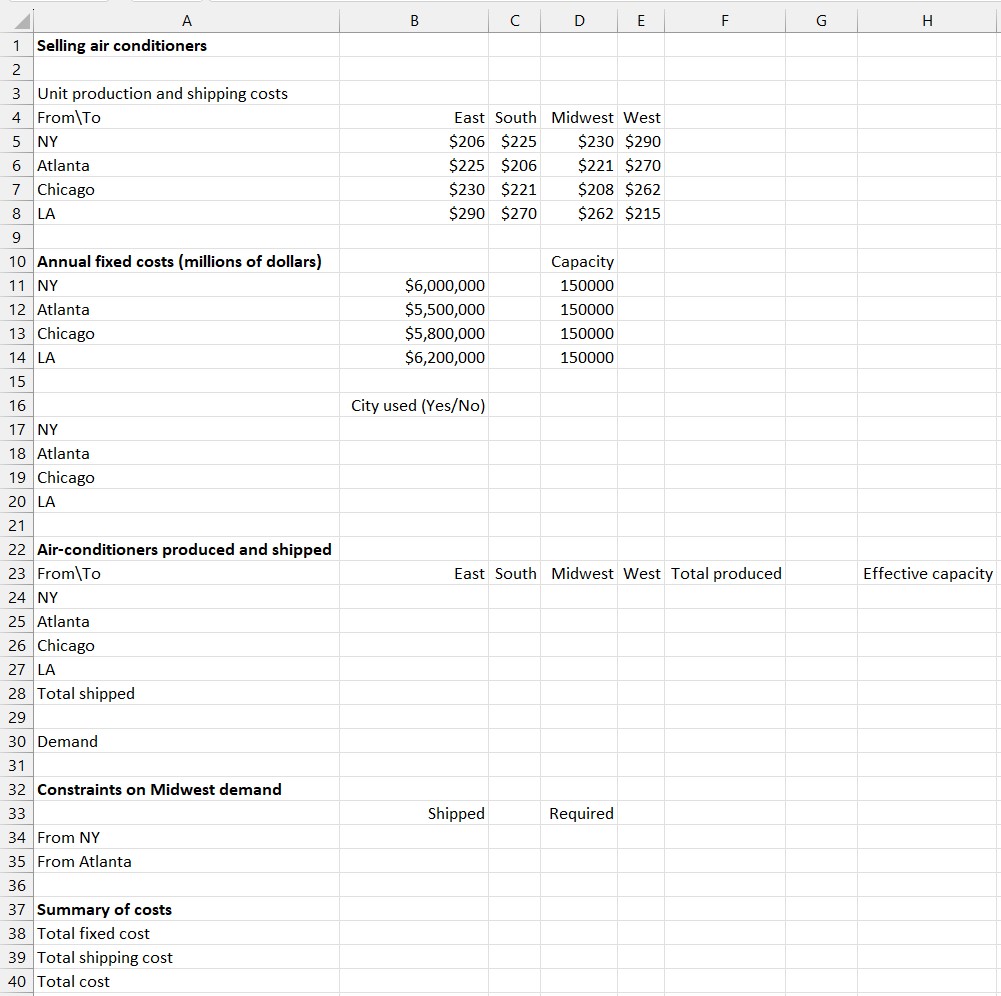 Selling air conditioners \begin{tabular}{|l|r|r|r|r|} \hline Unit production and shipping costs & & & & \\ \hline From\To & East & South & Midwest & West \\ \hline NY & $206 & $225 & $230 & $290 \\ \hline Atlanta & $225 & $206 & $221 & $270 \\ \hline Chicago & $230 & $221 & $208 & $262 \\ \hline LA & $290 & $270 & $262 & $215 \\ \hline \end{tabular} \begin{tabular}{|l|r|r|} \hline Annual fixed costs (millions of dollars) & & Capacity \\ \hline NY & $6,000,000 & 150000 \\ \hline Atlanta & $5,500,000 & 150000 \\ \hline Chicago & $5,800,000 & 150000 \\ \hline LA & $6,200,000 & 150000 \\ \hline \end{tabular} \begin{tabular}{|l|l|l|l|} \hline NY & City used (Yes/No) \\ \hline Atlanta & & \\ \hline Chicago & & \\ \hline LA & & \\ \hline \end{tabular} Air-conditioners produced and shipped From\To NY Atlanta Chicago LA Total shipped Demand Constraints on Midwest demand From NY From Atlanta Summary of costs Total fixed cost Total shipping cost Total cost \begin{tabular}{l|l|l|l|l|l|l|} B & C & D & E & F & G & H \end{tabular} \begin{tabular}{|r|r|r} & & \\ \hline East & South & Midwest \\ \hline$206 & $225 & $230 \\ \hline$225 & $206 & $221 \\ \hline$230 & $221 & $208 \\ \hline$290 & $270 & $262 \\ & & \\ \hline$6,000,000 & & 150000 \\ $55,500,000 & & 150000 \\ $5,800,000 & & 150000 \\ $6,200,000 & & 150000 \\ & & \\ \hline \end{tabular} East South Midwest West Total produced Effective capacity Selling air conditioners \begin{tabular}{|l|r|r|r|r|} \hline Unit production and shipping costs & & & & \\ \hline From\To & East & South & Midwest & West \\ \hline NY & $206 & $225 & $230 & $290 \\ \hline Atlanta & $225 & $206 & $221 & $270 \\ \hline Chicago & $230 & $221 & $208 & $262 \\ \hline LA & $290 & $270 & $262 & $215 \\ \hline \end{tabular} \begin{tabular}{|l|r|r|} \hline Annual fixed costs (millions of dollars) & & Capacity \\ \hline NY & $6,000,000 & 150000 \\ \hline Atlanta & $5,500,000 & 150000 \\ \hline Chicago & $5,800,000 & 150000 \\ \hline LA & $6,200,000 & 150000 \\ \hline \end{tabular} \begin{tabular}{|l|l|l|l|} \hline NY & City used (Yes/No) \\ \hline Atlanta & & \\ \hline Chicago & & \\ \hline LA & & \\ \hline \end{tabular} Air-conditioners produced and shipped From\To NY Atlanta Chicago LA Total shipped Demand Constraints on Midwest demand From NY From Atlanta Summary of costs Total fixed cost Total shipping cost Total cost \begin{tabular}{l|l|l|l|l|l|l|} B & C & D & E & F & G & H \end{tabular} \begin{tabular}{|r|r|r} & & \\ \hline East & South & Midwest \\ \hline$206 & $225 & $230 \\ \hline$225 & $206 & $221 \\ \hline$230 & $221 & $208 \\ \hline$290 & $270 & $262 \\ & & \\ \hline$6,000,000 & & 150000 \\ $55,500,000 & & 150000 \\ $5,800,000 & & 150000 \\ $6,200,000 & & 150000 \\ & & \\ \hline \end{tabular} East South Midwest West Total produced Effective capacity
 Step by Step Solution
There are 3 Steps involved in it
Step: 1

Get Instant Access to Expert-Tailored Solutions
See step-by-step solutions with expert insights and AI powered tools for academic success
Step: 2

Step: 3
Ace Your Homework with AI
Get the answers you need in no time with our AI-driven, step-by-step assistance
Get Started
The Future Of Audit Keeping Capital Markets Efficient
Authors: Keith Houghton, Christine Jubb, Michael Kend, Juliana Ng
1st Edition
1921666501, 978-1921666506