

Question
Use my findings and spss output to help solve and explain this question please do by hand These are the unemployment rates for these cities.
Use my findings and spss output to help solve and explain this question please do by hand
These are the unemployment rates for these cities.
idNameUnemployed
26 Enid 13.6
27 Lawton 16.7
28 Oklahoma City 7.1
29 Tulsa 8.9
Please show me how to create a new variable calledstate. Texas metropolitan areas should
be coded 1 for the new variable and Oklahoma MSAs are to be coded 2.
T-test= 1.509
Mean difference 0.222
Standard error difference -3.3710
95% confidence interval (2.2334, 3.4426)
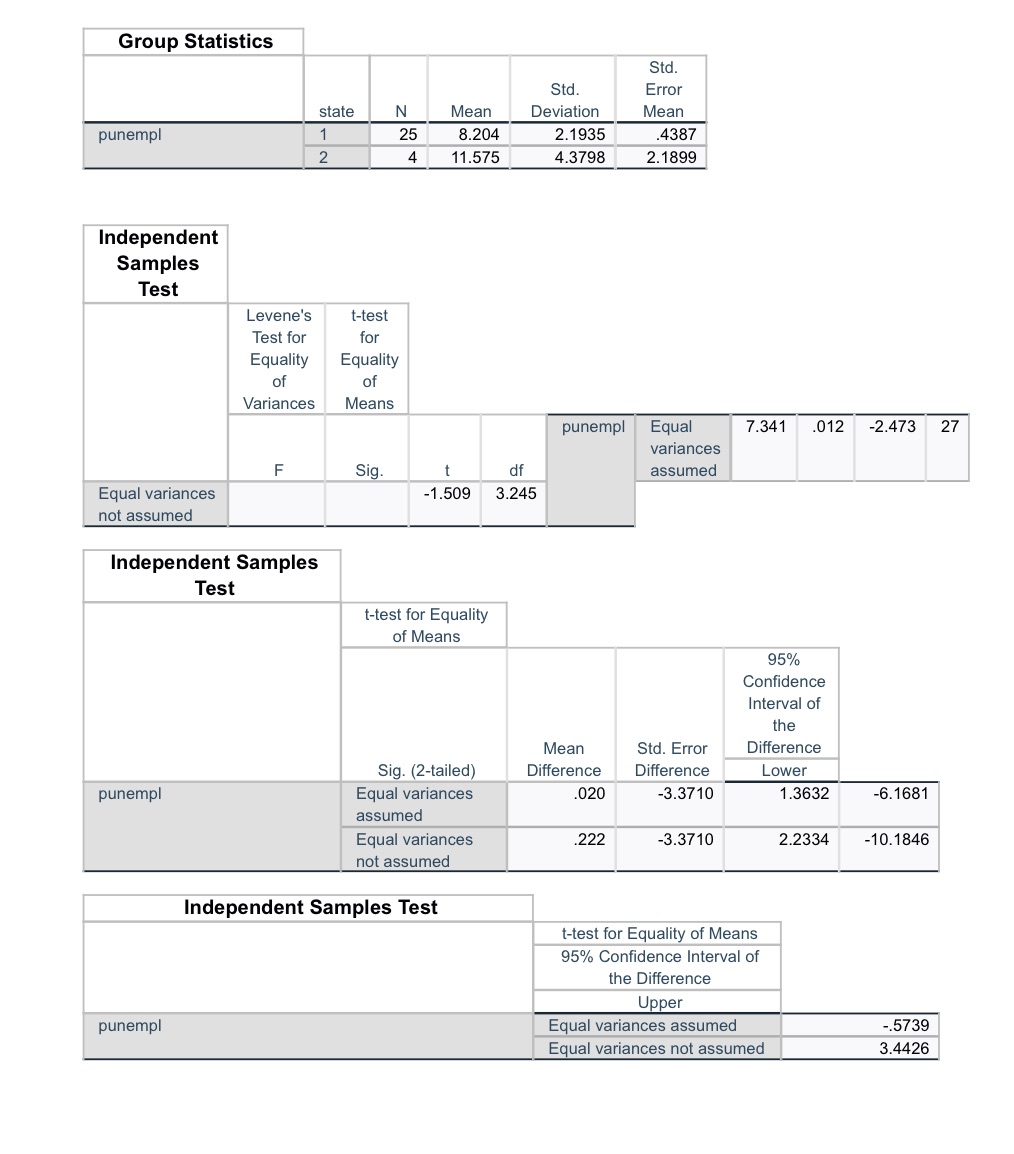 Group Statistics Std. Std. Error state N Mean Deviation Mean punempl 25 B.204 2.1935 4387 2 4 11.575 4.3798 2. 1899 Independent Samples Test Levene's t-test Test for for Equality Equality of of Variances Means punempl Equal 7.341 .012 -2.473 27 variances F Sig df assumed Equal variances -1.509 3.245 not assumed Independent Samples Test t-test for Equality of Means 95% Confidence Interval of the Mean Std. Error Difference Sig. (2-tailed) Difference Difference Lower punempl Equal variances 020 -3.3710 .3632 6.1681 assumed Equal variances 222 -3.3710 2.2334 -10.1846 not assumed Independent Samples Test t-test for Equality of Means 95% Confidence Interval of the Difference Upper punempl Equal variances assumed -.5739 Equal variances not assumed 3.4426
 Step by Step Solution
There are 3 Steps involved in it
Step: 1

Get Instant Access to Expert-Tailored Solutions
See step-by-step solutions with expert insights and AI powered tools for academic success
Step: 2

Step: 3
Ace Your Homework with AI
Get the answers you need in no time with our AI-driven, step-by-step assistance
Get Started
Algebra And Trigonometry Enhanced With Graphing Utilities (Subscription)
Authors: Michael, Michael Sullivan III, Michael III Sullivan, Michael Sullivan 111, III Sullivan
6th Edition
0321849132, 9780321849137