Answered step by step
Verified Expert Solution
Link Copied!

Question

1 Approved Answer

Use Pandas/Numpy for Python import numpy as np import pandas as pd df - pd. read_csv (https://raw.githubusercontent.com/fivethirtyeight/data/master/coll ege-majors/recent-grads.csv) unemp - df ['Unemployment_rate').copy) major - df
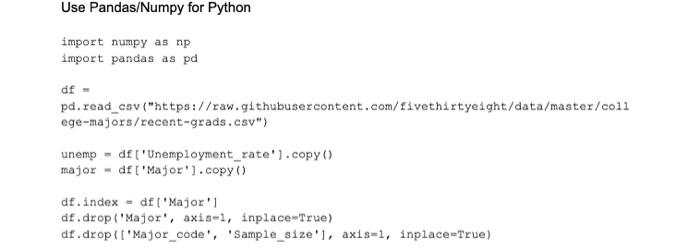
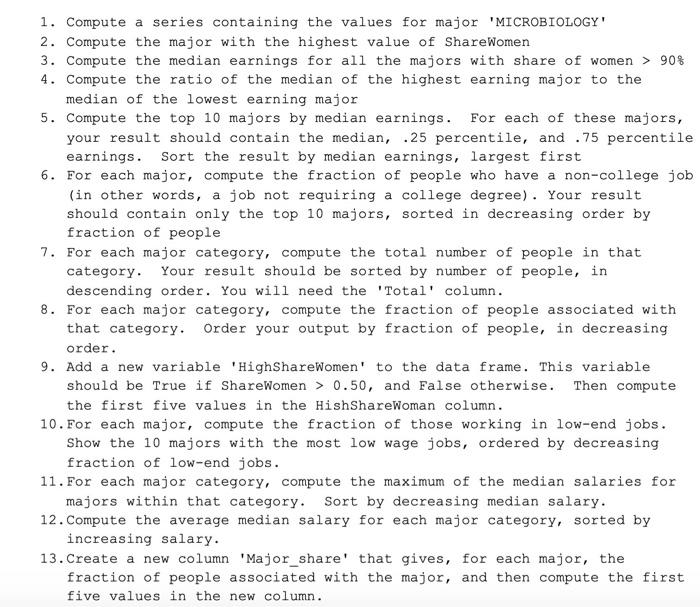
image text in transcribed
Use Pandas/Numpy for Python import numpy as np import pandas as pd df - pd. read_csv ("https://raw.githubusercontent.com/fivethirtyeight/data/master/coll ege-majors/recent-grads.csv") unemp - df ['Unemployment_rate').copy) major - df [ Major').copy) df.index = df ['Major'] df.drop('Major, axis-1, inplace True) df.drop('Major_code', 'Sample_size'), axis-1, inplace=True) 1. Compute a series containing the values for major 'MICROBIOLOGY 2. Compute the major with the highest value of ShareWomen 3. Compute the median earnings for all the majors with share of women > 90% 4. Compute the ratio of the median of the highest earning major to the median of the lowest earning major 5. Compute the top 10 majors by median earnings. For each of these majors, your result should contain the median, .25 percentile, and .75 percentile earnings. Sort the result by median earnings, largest first 6. For each major, compute the fraction of people who have a non-college job (in other words, a job not requiring a college degree). Your result should contain only the top 10 majors, sorted in decreasing order by fraction of people 7. For each major category, compute the total number of people in that category. Your result should be sorted by number of people, in descending order. You will need the 'Total' column. 8. For each major category, compute the fraction of people associated with that category. Order your output by fraction of people, in decreasing order. 9. Add a new variable 'HighShareWomen' to the data frame. This variable should be True if ShareWomen > 0.50, and False otherwise. Then compute the first five values in the HishShareWoman column. 10. For each major, compute the fraction of those working in low-end jobs. Show the 10 majors with the most low wage jobs, ordered by decreasing fraction of low-end jobs. 11. For each major category, compute the maximum of the median salaries for majors within that category. Sort by decreasing median salary. 12. Compute the average median salary for each major category, sorted by increasing salary. 13. Create a new column 'Major_share' that gives, for each major, the fraction of people associated with the major, and then compute the first five values in the new column

Step by Step Solution

There are 3 Steps involved in it

Step: 1

blur-text-image

Get Instant Access to Expert-Tailored Solutions

See step-by-step solutions with expert insights and AI powered tools for academic success

Step: 2

blur-text-image

Step: 3

blur-text-image

Ace Your Homework with AI

Get the answers you need in no time with our AI-driven, step-by-step assistance

Get Started

Recommended Textbook for

Oracle Autonomous Database In Enterprise Architecture

Authors: Bal Mukund Sharma, Krishnakumar KM, Rashmi Panda

1st Edition

1801072248, 978-1801072243

More Books

Students also viewed these Databases questions

Question

What is the Definition for Third Normal Form?

Answered: 1 week ago

Question

Provide two examples of a One-To-Many relationship.

Answered: 1 week ago