

Answered step by step
Verified Expert Solution
Question
1 Approved Answer
Use Python to solve the following problem: (stinkbug.png picture below) 3. Use the matplotlib.image.imread command to load the stinkbug.png file, which returns a NumPy array
Use Python to solve the following problem:
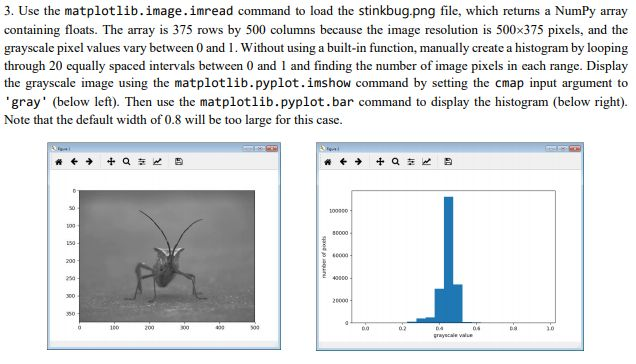
("stinkbug.png" picture below)
Step by Step Solution
There are 3 Steps involved in it
Step: 1

Get Instant Access to Expert-Tailored Solutions
See step-by-step solutions with expert insights and AI powered tools for academic success
Step: 2

Step: 3
Ace Your Homework with AI
Get the answers you need in no time with our AI-driven, step-by-step assistance
Get Started
Rules In Database Systems Third International Workshop Rids 97 Sk Vde Sweden June 26 28 1997 Proceedings Lncs 1312
Authors: Andreas Geppert ,Mikael Berndtsson
1997th Edition
3540635165, 978-3540635161