Answered step by step
Verified Expert Solution
Question
1 Approved Answer
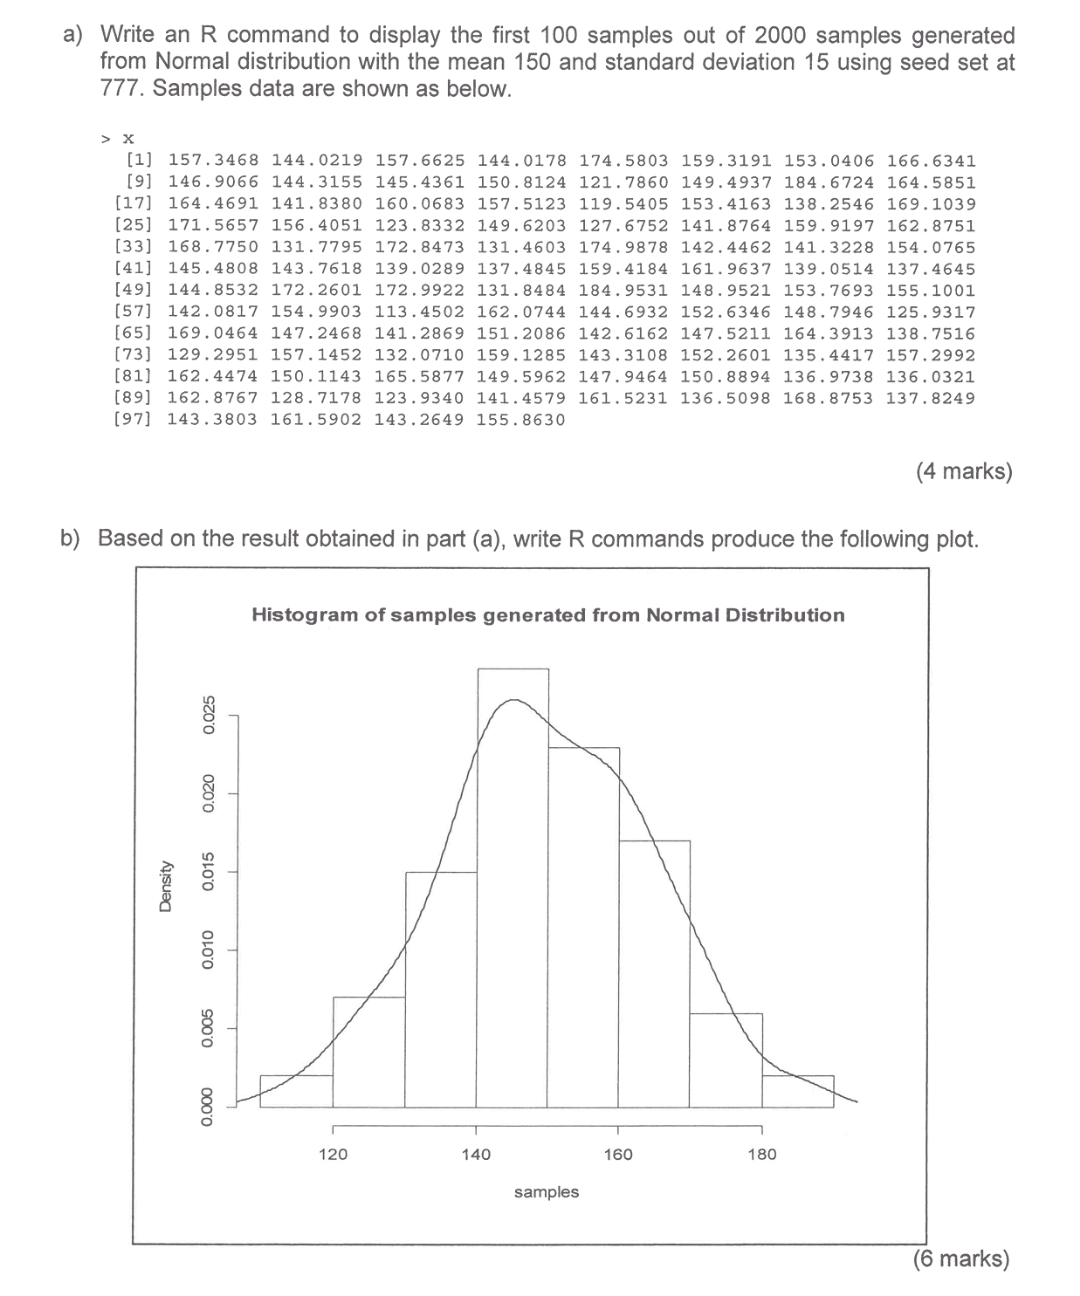
use r command to answer a) and b) a) Write an R command to display the first 100 samples out of 2000 samples generated from

use r command to answer a) and b)
a) Write an R command to display the first 100 samples out of 2000 samples generated from Normal distribution with the mean 150 and standard deviation 15 using seed set at 777. Samples data are shown as below. > X [1] 157.3468 144.0219 157.6625 144.0178 174.5803 159.3191 153.0406 166.6341 [9] 146.9066 144.3155 145.4361 150.8124 121.7860 149.4937 184.6724 164.5851 [17] 164.4691 141.8380 160.0683 157.5123 119.5405 153.4163 138.2546 169.1039 [25] 171.5657 156.4051 123.8332 149.6203 127.6752 141.8764 159.9197 162.8751 [33] 168.7750 131.7795 172.8473 131.4603 174.9878 142.4462 141.3228 154.0765 [41] 145.4808 143.7618 139.0289 137.4845 159.4184 161.9637 139.0514 137.4645 [49] 144.8532 172.2601 172.9922 131.8484 184.9531 148.9521 153.7693 155.1001 [57] 142.0817 154.9903 113.4502 162.0744 144.6932 152.6346 148.7946 125.9317 [65] 169.0464 147.2468 141.2869 151.2086 142.6162 1475211 164.3913 138.7516 (73) 129.2951 157.1452 132.0710 159.1285 143.3108 152.2601 135.4417 157.2992 [81] 162.4474 150.1143 165.5877 149.5962 147.9464 150.8894 136.9738 136.0321 [89] 162.8767 128.7178 123.9340 141.4579 161.5231 136.5098 168.8753 137.8249 [97] 143.3803 161.5902 143.2649 155.8630 (4 marks) b) Based on the result obtained in part (a), write R commands produce the following plot. Histogram of samples generated from Normal Distribution 0.025 0.020 Density 0.015 0.010 0.005 0.000 120 140 160 180 samples (6 marks)Step by Step Solution
There are 3 Steps involved in it
Step: 1

Get Instant Access to Expert-Tailored Solutions
See step-by-step solutions with expert insights and AI powered tools for academic success
Step: 2

Step: 3

Ace Your Homework with AI
Get the answers you need in no time with our AI-driven, step-by-step assistance
Get Started


