Answered step by step
Verified Expert Solution
Question
1 Approved Answer
Use R to install taylor dataset by entering in the command window: install.packages(forecast) library(forecast) taylor This gives you the taylor dataset 3. taylor is a
Use R to install taylor dataset by entering in the command window:
install.packages("forecast")
library(forecast)
taylor
This gives you the taylor dataset 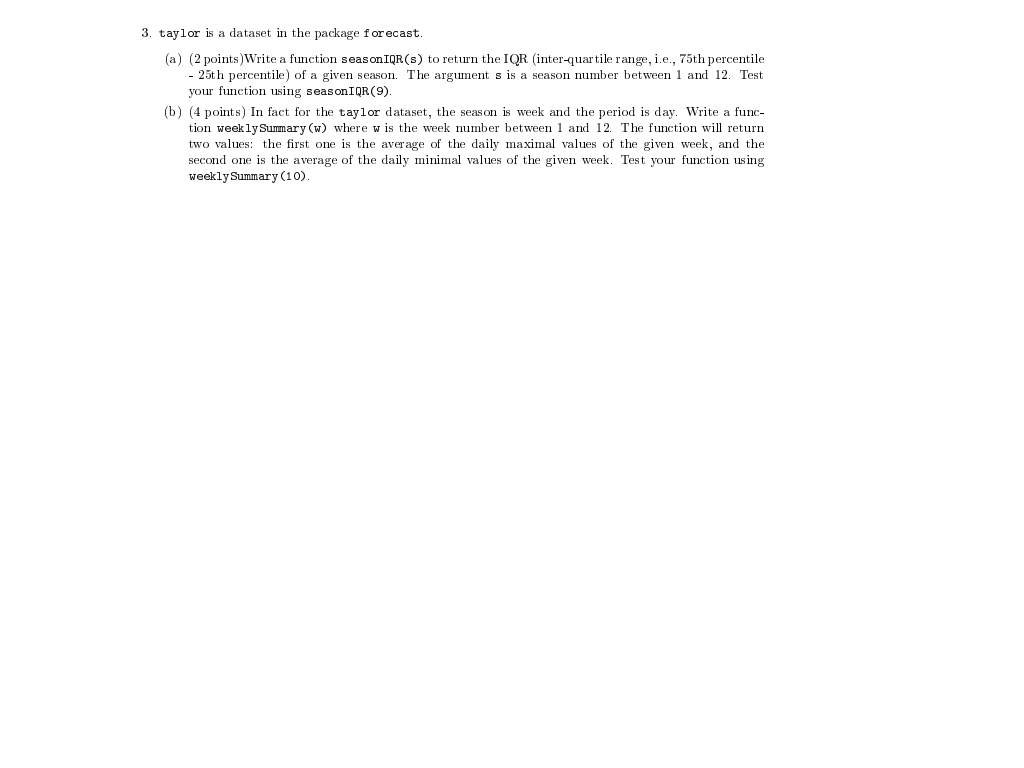
Step by Step Solution
There are 3 Steps involved in it
Step: 1

Get Instant Access to Expert-Tailored Solutions
See step-by-step solutions with expert insights and AI powered tools for academic success
Step: 2

Step: 3
Ace Your Homework with AI
Get the answers you need in no time with our AI-driven, step-by-step assistance
Get Started