

Answered step by step
Verified Expert Solution
Question
1 Approved Answer
Use Sheet 1 of the Excel file to answer the following questions. A school administrator believes that the mean class GPAs for a given course
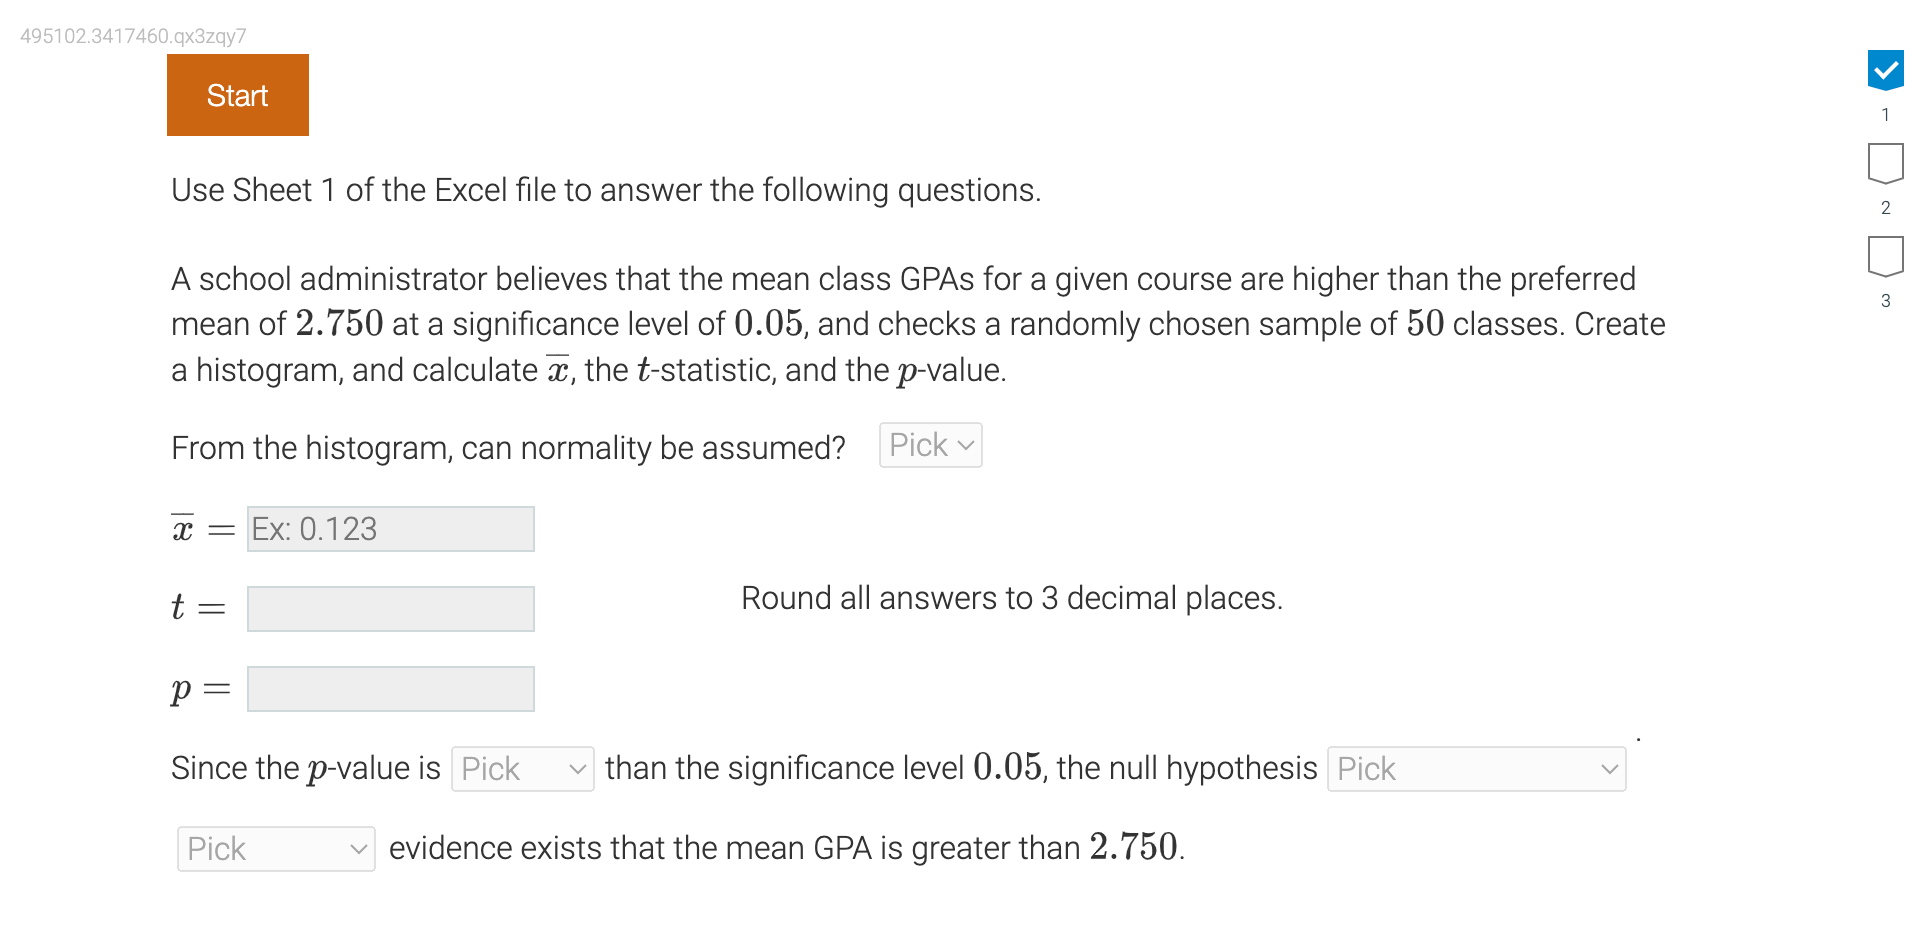
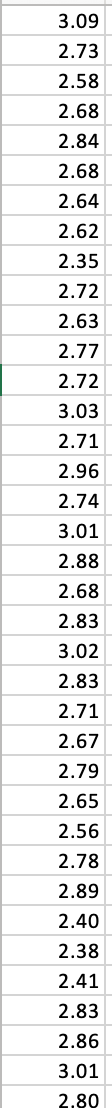
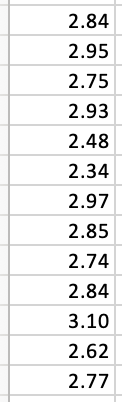
Use Sheet 1 of the Excel file to answer the following questions. A school administrator believes that the mean class GPAs for a given course are higher than the preferred mean of 2.750 at a significance level of 0.05 , and checks a randomly chosen sample of 50 classes. Create a histogram, and calculate x, the t-statistic, and the p-value. From the histogram, can normality be assumed? x= t= Round all answers to 3 decimal places. p= Since the p-value is than the significance level 0.05 , the null hypothesis evidence exists that the mean GPA is greater than 2.750 . \begin{tabular}{|l} \hline 3.09 \\ \hline 2.73 \\ \hline 2.58 \\ \hline 2.68 \\ \hline 2.84 \\ \hline 2.68 \\ \hline 2.64 \\ \hline 2.62 \\ \hline 2.35 \\ \hline 2.72 \\ \hline 2.63 \\ \hline 2.77 \\ \hline 2.72 \\ \hline 3.03 \\ \hline 2.71 \\ \hline 2.96 \\ \hline 2.74 \\ \hline 3.01 \\ \hline 2.88 \\ \hline 2.68 \\ \hline 2.83 \\ \hline 3.02 \\ \hline 2.83 \\ \hline 2.71 \\ \hline 2.67 \\ \hline 2.79 \\ \hline 2.65 \\ \hline 2.56 \\ \hline 2.78 \\ \hline 2.89 \\ \hline 2.40 \\ \hline 2.38 \\ \hline 2.41 \\ \hline 2.83 \\ \hline 2.86 \\ \hline 3.01 \\ \hline 2.80 \\ \hline \end{tabular} \begin{tabular}{|r|} \hline 2.84 \\ \hline 2.95 \\ \hline 2.75 \\ \hline 2.93 \\ \hline 2.48 \\ \hline 2.34 \\ \hline 2.97 \\ \hline 2.85 \\ \hline 2.74 \\ \hline 2.84 \\ \hline 3.10 \\ \hline 2.62 \\ \hline 2.77 \\ \hline \end{tabular} Use Sheet 1 of the Excel file to answer the following questions. A school administrator believes that the mean class GPAs for a given course are higher than the preferred mean of 2.750 at a significance level of 0.05 , and checks a randomly chosen sample of 50 classes. Create a histogram, and calculate x, the t-statistic, and the p-value. From the histogram, can normality be assumed? x= t= Round all answers to 3 decimal places. p= Since the p-value is than the significance level 0.05 , the null hypothesis evidence exists that the mean GPA is greater than 2.750 . \begin{tabular}{|l} \hline 3.09 \\ \hline 2.73 \\ \hline 2.58 \\ \hline 2.68 \\ \hline 2.84 \\ \hline 2.68 \\ \hline 2.64 \\ \hline 2.62 \\ \hline 2.35 \\ \hline 2.72 \\ \hline 2.63 \\ \hline 2.77 \\ \hline 2.72 \\ \hline 3.03 \\ \hline 2.71 \\ \hline 2.96 \\ \hline 2.74 \\ \hline 3.01 \\ \hline 2.88 \\ \hline 2.68 \\ \hline 2.83 \\ \hline 3.02 \\ \hline 2.83 \\ \hline 2.71 \\ \hline 2.67 \\ \hline 2.79 \\ \hline 2.65 \\ \hline 2.56 \\ \hline 2.78 \\ \hline 2.89 \\ \hline 2.40 \\ \hline 2.38 \\ \hline 2.41 \\ \hline 2.83 \\ \hline 2.86 \\ \hline 3.01 \\ \hline 2.80 \\ \hline \end{tabular} \begin{tabular}{|r|} \hline 2.84 \\ \hline 2.95 \\ \hline 2.75 \\ \hline 2.93 \\ \hline 2.48 \\ \hline 2.34 \\ \hline 2.97 \\ \hline 2.85 \\ \hline 2.74 \\ \hline 2.84 \\ \hline 3.10 \\ \hline 2.62 \\ \hline 2.77 \\ \hline \end{tabular}
Step by Step Solution
There are 3 Steps involved in it
Step: 1

Get Instant Access to Expert-Tailored Solutions
See step-by-step solutions with expert insights and AI powered tools for academic success
Step: 2

Step: 3
Ace Your Homework with AI
Get the answers you need in no time with our AI-driven, step-by-step assistance
Get Started
Primary Science Audit And Test
Authors: Jenny Byrne, Andri Christodoulou, John Sharp
4th Edition
1446282732, 978-1446282731