Question: Use Sklearn.svm . SVC with linear kernel to classify the dataset below. Change parameter C in the range 0 . 0 1 , 0 .
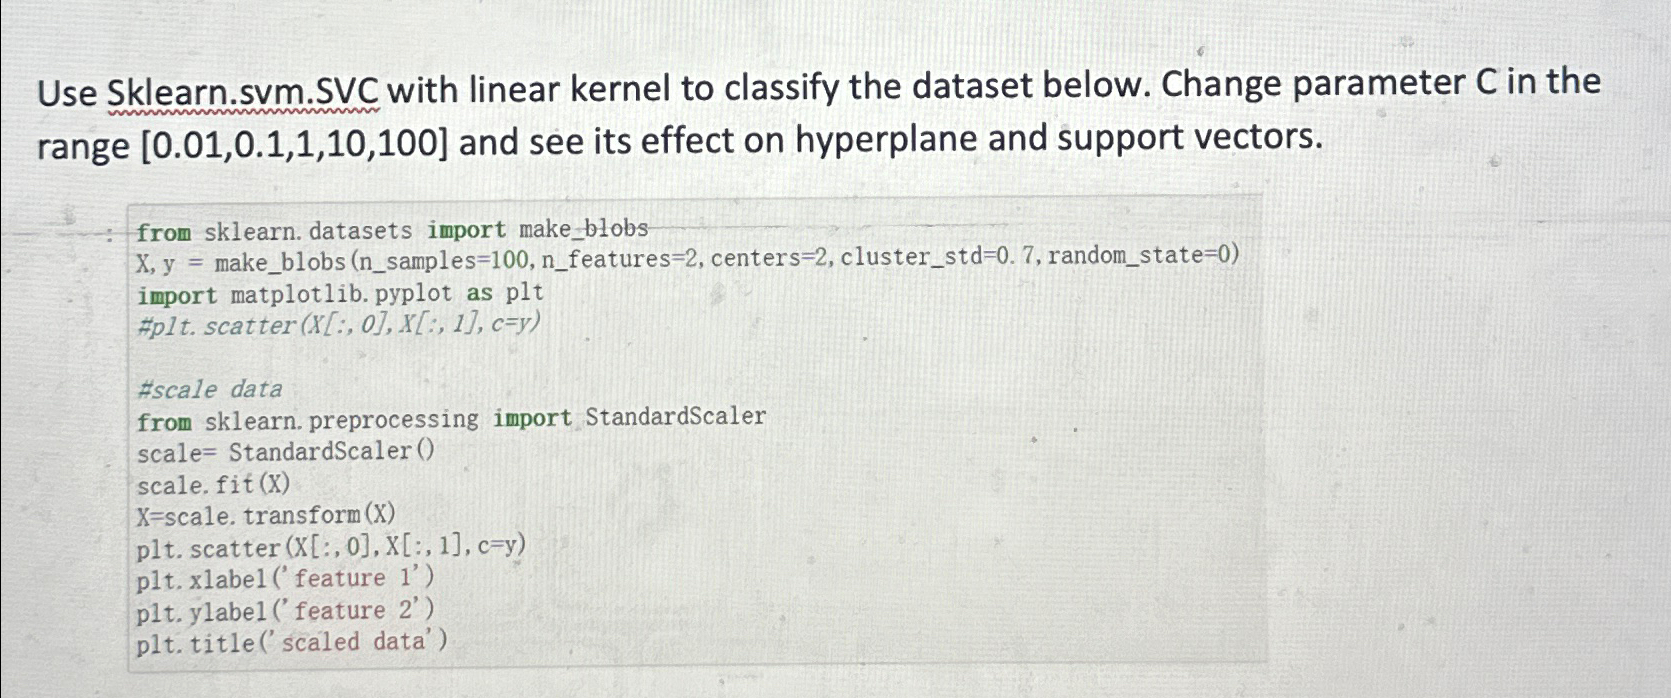
Use Sklearn.svmSVC with linear kernel to classify the dataset below. Change parameter in the range and see its effect on hyperplane and support vectors.
from sklearn. datasets import makeblobs
makeblobs nsamples eatures centers clusterstd randomstate
import matplotlib. pyplot as plt
#pt scatter
#scale data
from sklearn. preprocessing import StandardScaler
scale StandardScaler
scale. fit
scale. transform
plt
plt Xlabel feature
pt ylabel feature
plt title scaled data'

Step by Step Solution
There are 3 Steps involved in it
1 Expert Approved Answer
Step: 1 Unlock


Question Has Been Solved by an Expert!
Get step-by-step solutions from verified subject matter experts
Step: 2 Unlock
Step: 3 Unlock


