Answered step by step
Verified Expert Solution
Question
1 Approved Answer
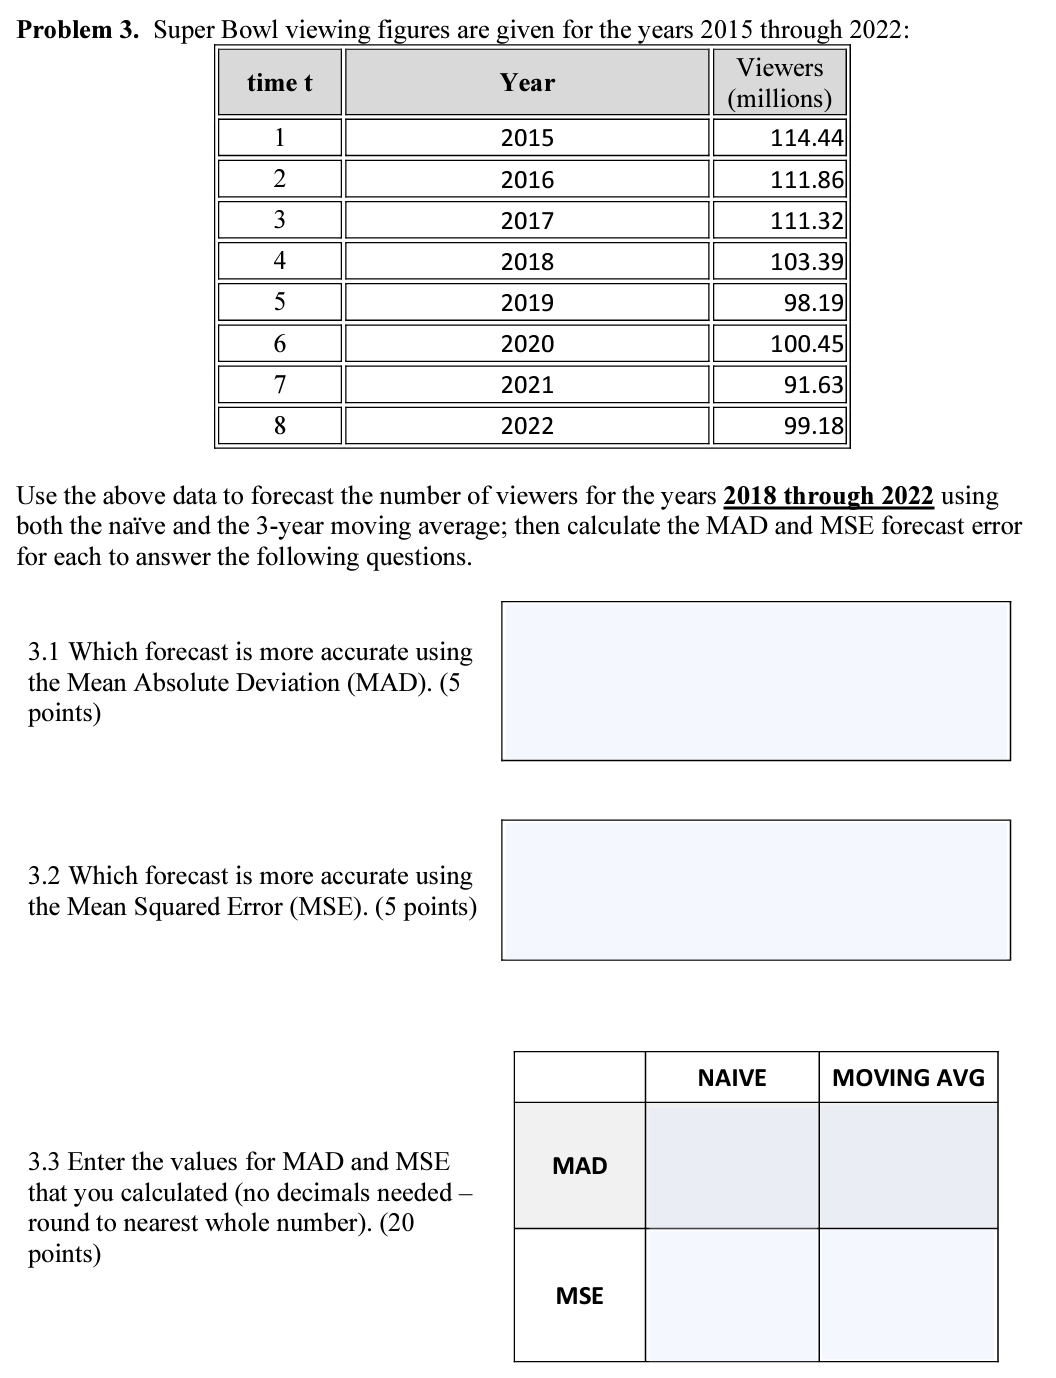
Use the above data to forecast the number of viewers for the years 2018 through 2022 using both the nave and the 3-year moving average;


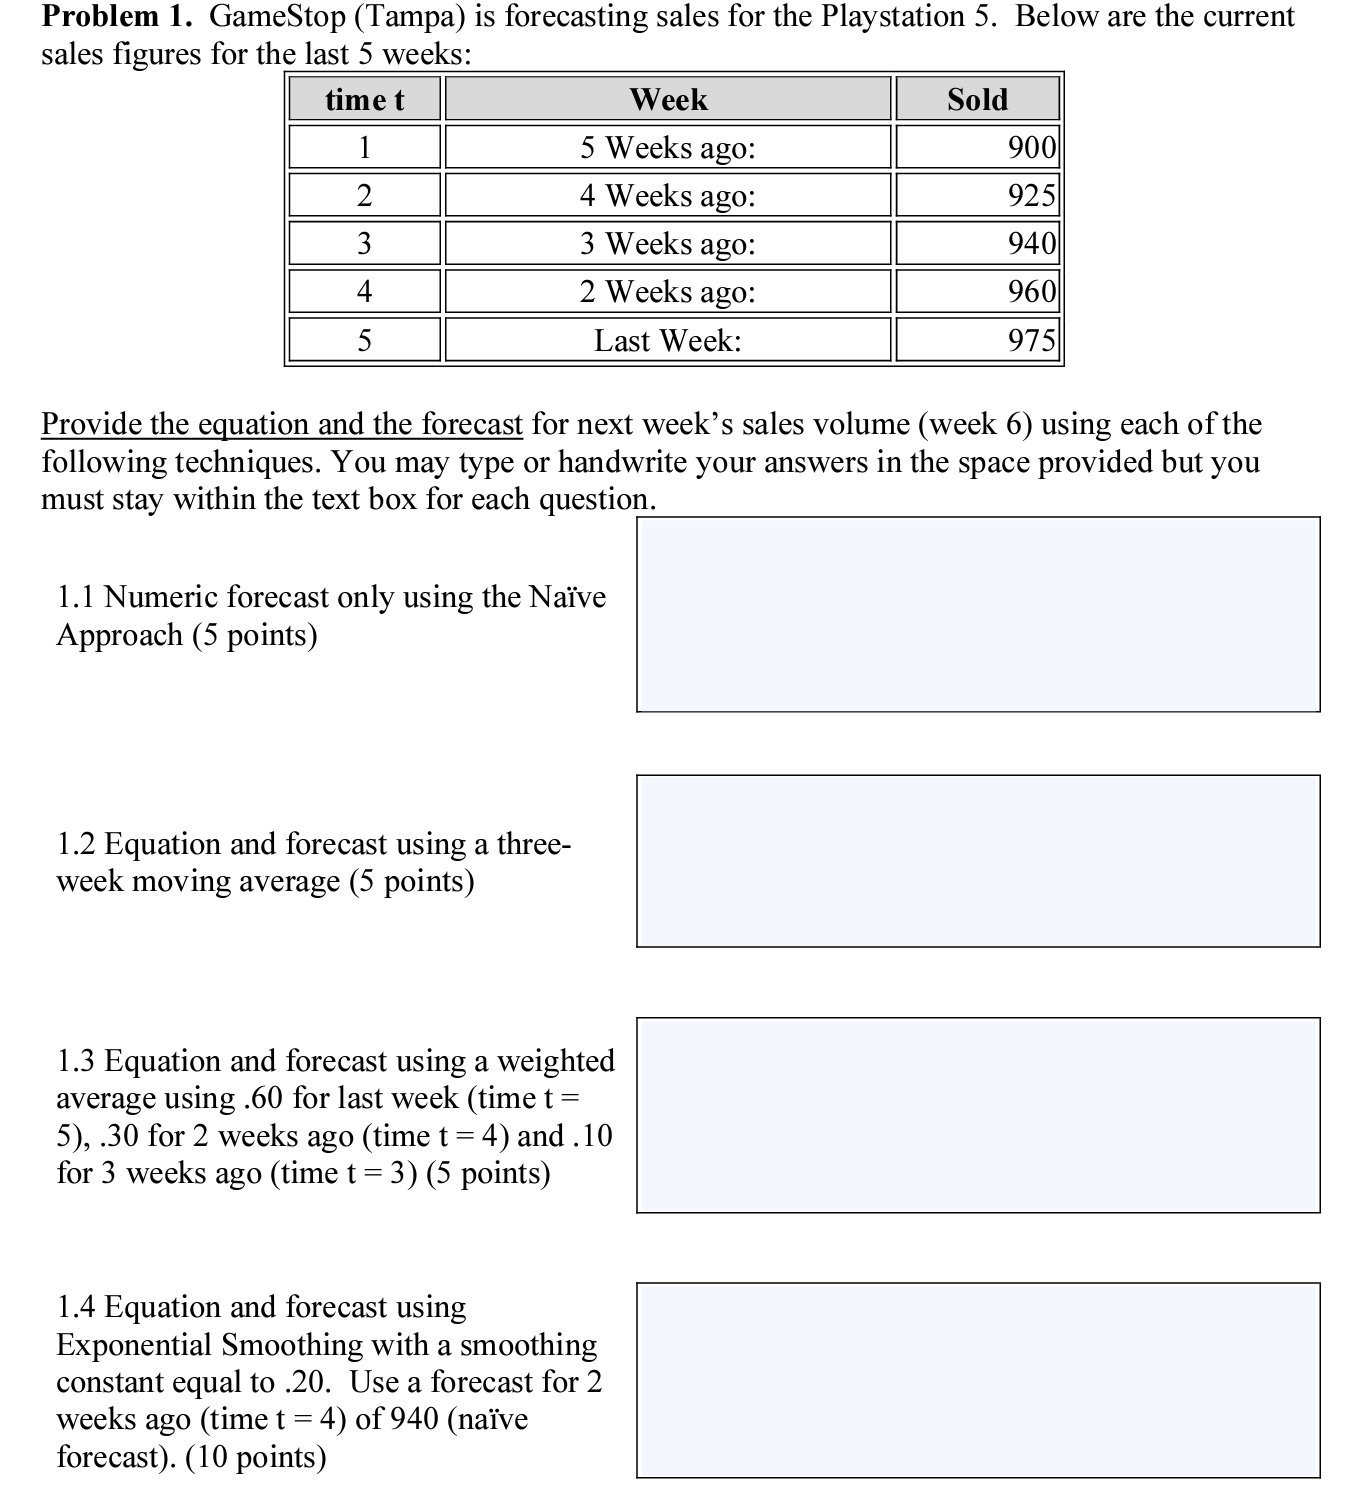
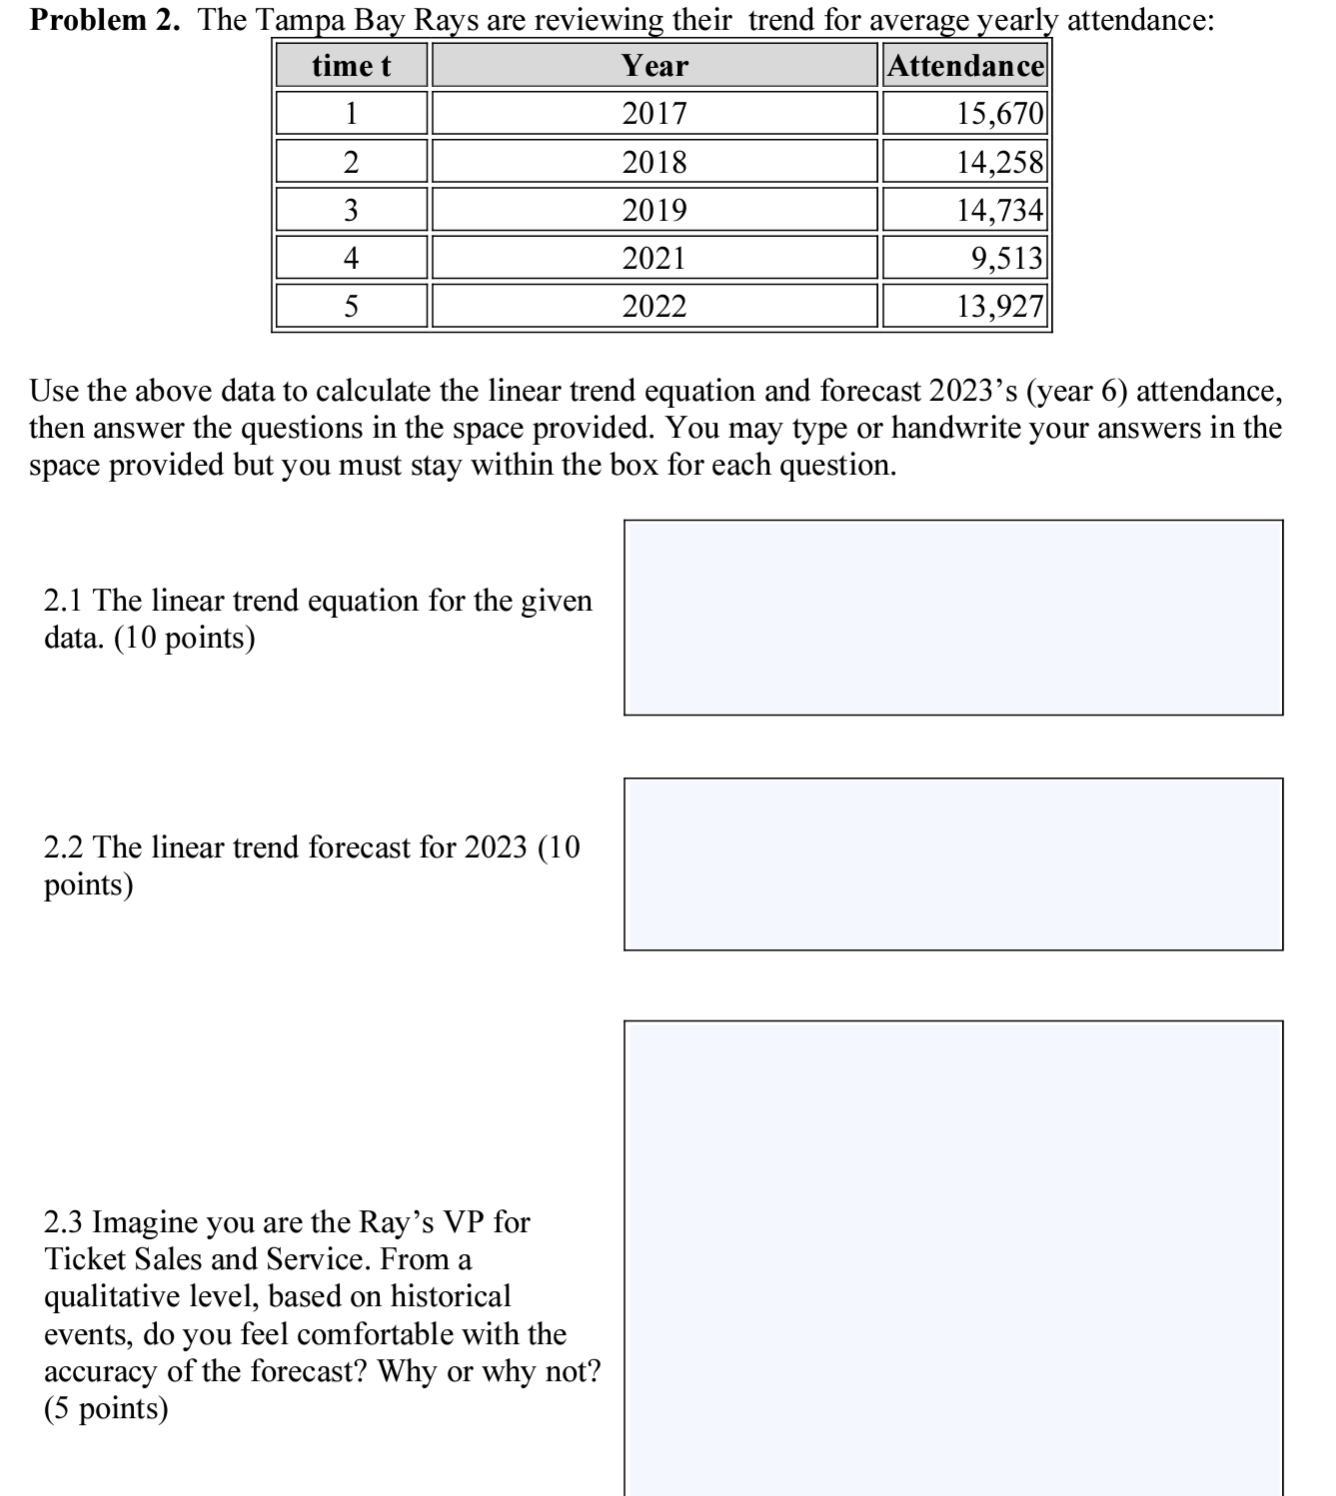
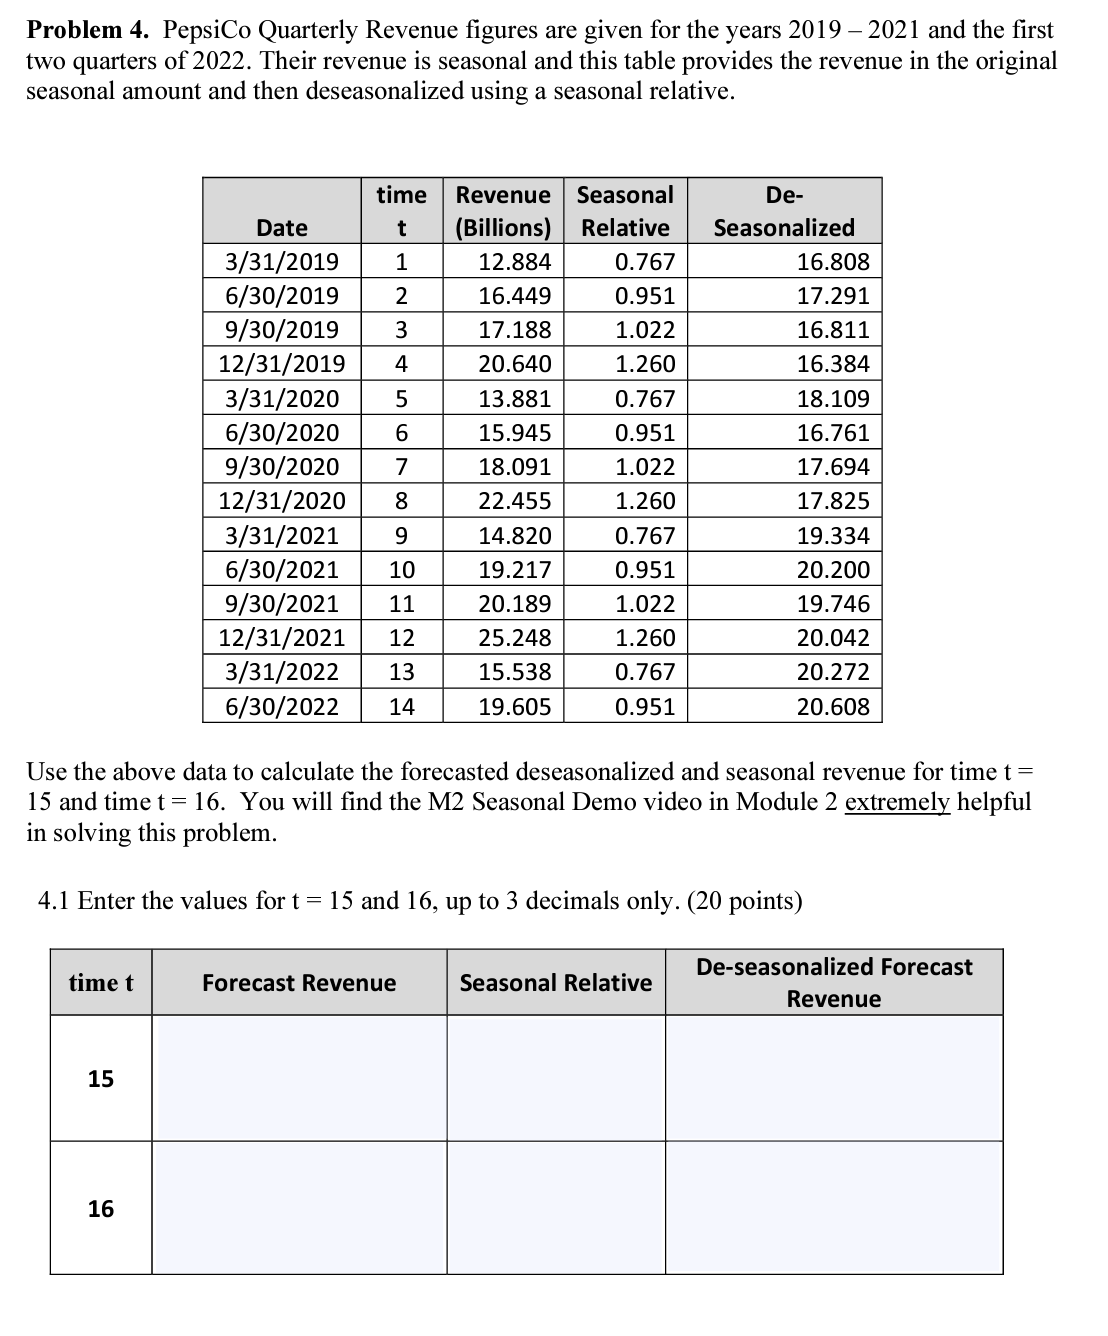
 Use the above data to forecast the number of viewers for the years 2018 through 2022 using both the nave and the 3-year moving average; then calculate the MAD and MSE forecast error for each to answer the following questions. 3.1 Which forecast is more accurate using the Mean Absolute Deviation (MAD). (5 points) 3.2 Which forecast is more accurate using the Mean Squared Error (MSE). (5 points) 3.3 Enter the values for MAD and MSE that you calculated (no decimals needed round to nearest whole number). (20 points) Use the above data to calculate the linear trend equation and forecast 2023's (year 6) attendance, then answer the questions in the space provided. You may type or handwrite your answers in the space provided but you must stay within the box for each question. 2.1 The linear trend equation for the given data. (10 points) 2.2 The linear trend forecast for 2023 (10 points) 2.3 Imagine you are the Ray's VP for Ticket Sales and Service. From a qualitative level, based on historical events, do you feel comfortable with the accuracy of the forecast? Why or why not? (5 points) Problem 1. GameStop (Tampa) is forecasting sales for the Playstation 5. Below are the current sales figures for the last 5 weeks: Provide the equation and the forecast for next week's sales volume (week 6) using each of the following techniques. You may type or handwrite your answers in the space provided but you must stay within the text box for each question. 1.1 Numeric forecast only using the Nave Approach (5 points) 1.2 Equation and forecast using a threeweek moving average ( 5 points) 1.3 Equation and forecast using a weighted average using .60 for last week (time t= 5), .30 for 2 weeks ago (time t=4) and .10 for 3 weeks ago (time t=3) ( 5 points) 1.4 Equation and forecast using Exponential Smoothing with a smoothing constant equal to .20 . Use a forecast for 2 weeks ago (time t=4 ) of 940 (nave forecast). (10 points) Problem 4. PepsiCo Quarterly Revenue figures are given for the years 20192021 and the first two quarters of 2022 . Their revenue is seasonal and this table provides the revenue in the original seasonal amount and then deseasonalized using a seasonal relative. Use the above data to calculate the forecasted deseasonalized and seasonal revenue for time t= 15 and time t=16. You will find the M2 Seasonal Demo video in Module 2 extremely helpful in solving this problem. 4.1 Enter the values for t=15 and 16 , up to 3 decimals only. ( 20 points)
 Step by Step Solution
There are 3 Steps involved in it
Step: 1

Get Instant Access to Expert-Tailored Solutions
See step-by-step solutions with expert insights and AI powered tools for academic success
Step: 2

Step: 3

Ace Your Homework with AI
Get the answers you need in no time with our AI-driven, step-by-step assistance
Get Started


