Answered step by step
Verified Expert Solution
Link Copied!

Question

1 Approved Answer

Use the attached sample data to create a similar graph as shown in the video you watched to do market analysis. In the sample data
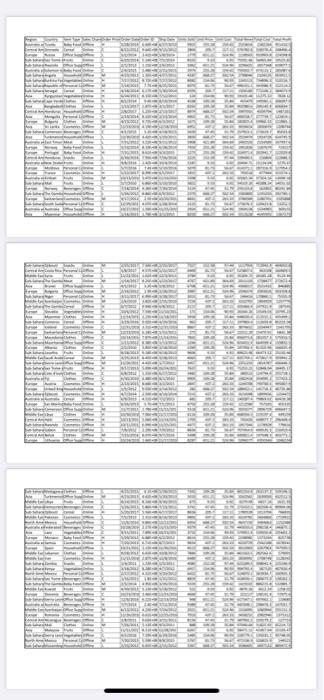
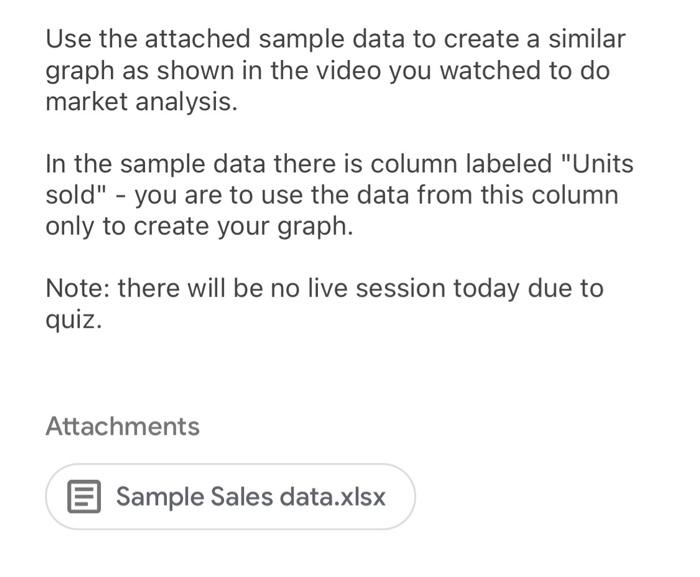
image text in transcribed
Use the attached sample data to create a similar graph as shown in the video you watched to do market analysis. In the sample data there is column labeled "Units sold" - you are to use the data from this column only to create your graph. Note: there will be no live session today due to quiz. Attachments 5 Sample Sales data.xlsx Use the attached sample data to create a similar graph as shown in the video you watched to do market analysis. In the sample data there is column labeled "Units sold" - you are to use the data from this column only to create your graph. Note: there will be no live session today due to quiz. Attachments 5 Sample Sales data.xlsx

Step by Step Solution

There are 3 Steps involved in it

Step: 1

blur-text-image

Get Instant Access to Expert-Tailored Solutions

See step-by-step solutions with expert insights and AI powered tools for academic success

Step: 2

blur-text-image

Step: 3

blur-text-image

Ace Your Homework with AI

Get the answers you need in no time with our AI-driven, step-by-step assistance

Get Started

Recommended Textbook for

Managerial Accounting Selected Chapters For The University Of Oklahoma

Authors: Unknown Author

12th Edition

0077218256, 978-0077218256

More Books

Students also viewed these Accounting questions