

Answered step by step
Verified Expert Solution
Question
1 Approved Answer
Use the data from Q3 to create two active portfolios that will be designed to take advantage of a bull market over the next 3
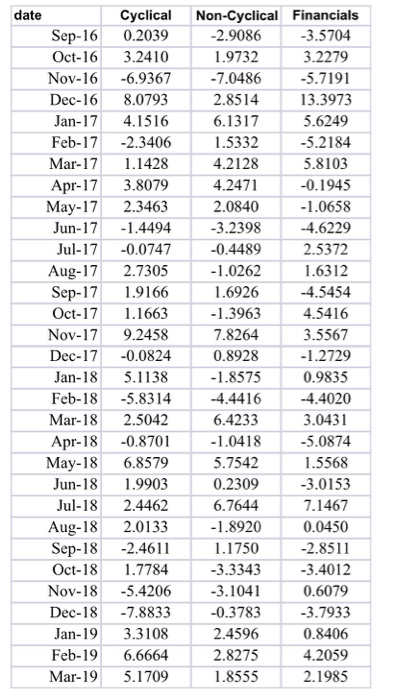
Use the data from Q3 to create two active portfolios that will be designed to take advantage of a bull market over the next 3 to 6 months (from March 2019). You will create a portfolio based on Risk Allocation (RA) that will outperform the equal-weighted (EW) portfolio created above in Question 3 (also the benchmark portfolio). You will use the variance-covariance matrix of the three indexes over the whole period to create the Risk allocated portfolio. You will next create a Risk Allocated portfolio by allocating risk to each industry sector to calculate the weights of each sector based on the risk allocation. You will now calculate the marginal contribution to tracking error for each Industry sector.
Step by Step Solution
There are 3 Steps involved in it
Step: 1

Get Instant Access to Expert-Tailored Solutions
See step-by-step solutions with expert insights and AI powered tools for academic success
Step: 2

Step: 3
Ace Your Homework with AI
Get the answers you need in no time with our AI-driven, step-by-step assistance
Get Started
The Sterling Bonds And Fixed Income Handbook
Authors: Mark Glowrey
1st Edition
0857190423, 978-0857190420