

Answered step by step
Verified Expert Solution
Question
1 Approved Answer
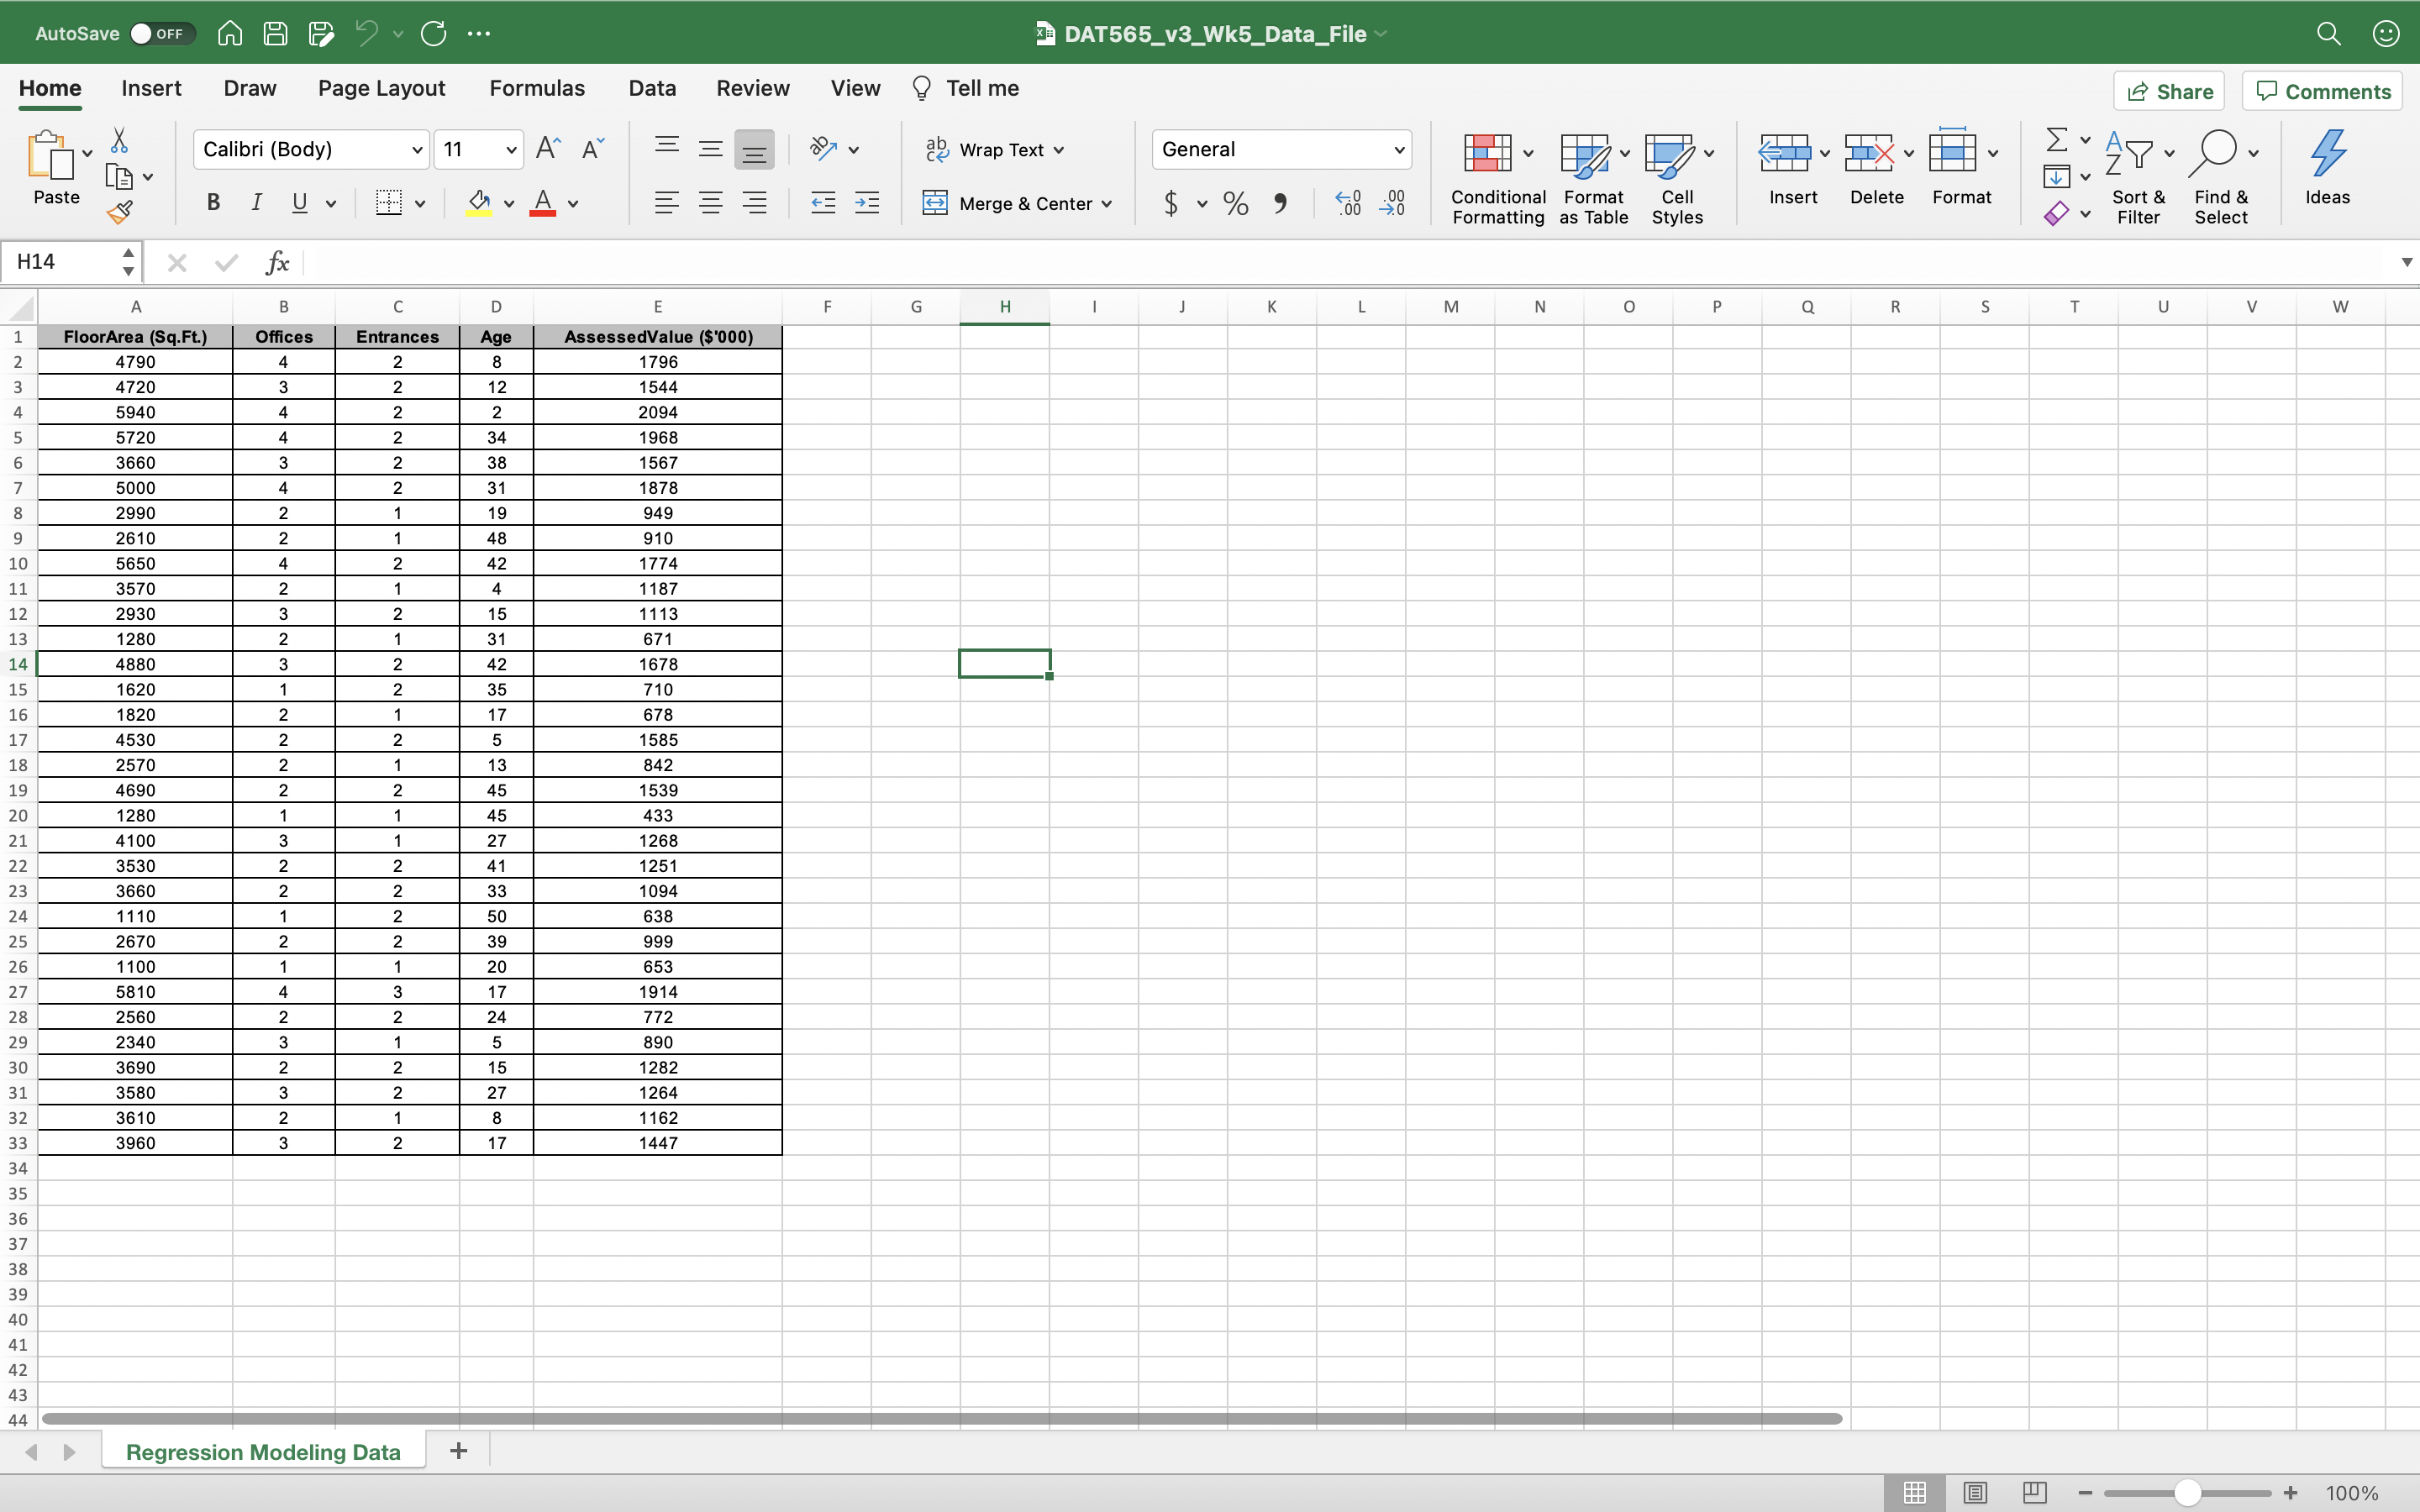
Use the data to construct a model that predicts the tax assessment value assigned to medical office buildings with specific characteristics. Construct a scatter plot
Use the data to construct a model that predicts the tax assessment value assigned to medical office buildings with specific characteristics.
- Construct a scatter plot in Excel with FloorArea as the independent variable and AssessmentValue as the dependent variable. Insert the bivariate linear regression equation and r^2 in your graph. Do you observe a linear relationship between the 2 variables?
- Use Excel's Analysis ToolPak to conduct a regression analysis of FloorArea and AssessmentValue. Is FloorArea a significant predictor of AssessmentValue?
- Construct a scatter plot in Excel with Age as the independent variable and AssessmentValue as the dependent variable. Insert the bivariate linear regression equation and r^2 in your graph. Do you observe a linear relationship between the 2 variables?
- Use Excel's Analysis ToolPak to conduct a regression analysis of Age and Assessment Value. Is Age a significant predictor of AssessmentValue?
Step by Step Solution
There are 3 Steps involved in it
Step: 1

Get Instant Access to Expert-Tailored Solutions
See step-by-step solutions with expert insights and AI powered tools for academic success
Step: 2

Step: 3
Ace Your Homework with AI
Get the answers you need in no time with our AI-driven, step-by-step assistance
Get Started
Trigonometry
Authors: Cynthia Y Young
5th Edition
1119820928, 9781119820925