Question
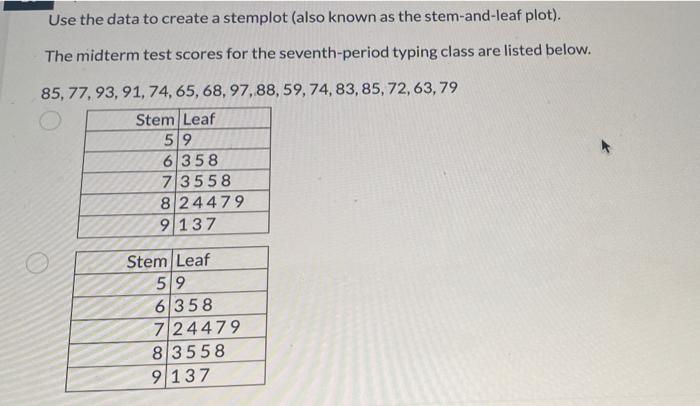
Use the data to create a stemplot (also known as the stem-and-leaf plot). The midterm test scores for the seventh-period typing class are listed

Use the data to create a stemplot (also known as the stem-and-leaf plot). The midterm test scores for the seventh-period typing class are listed below. 85, 77, 93, 91, 74, 65, 68, 97, 88, 59, 74, 83, 85, 72, 63, 79 Stem Leaf 59 6 358 73558 824479 9137 Stem Leaf 59 6 358 724479 83558 9137
Step by Step Solution
3.47 Rating (163 Votes )
There are 3 Steps involved in it
Step: 1
Given 16 first we increasing order Now its written ...
Get Instant Access to Expert-Tailored Solutions
See step-by-step solutions with expert insights and AI powered tools for academic success
Step: 2

Step: 3

Ace Your Homework with AI
Get the answers you need in no time with our AI-driven, step-by-step assistance
Get StartedRecommended Textbook for
Complete Business Statistics
Authors: Amir Aczel, Jayavel Sounderpandian
7th Edition
9780071077903, 73373605, 71077901, 9780073373607, 77239695, 978-0077239695
Students also viewed these Accounting questions
Question
Answered: 1 week ago
Question
Answered: 1 week ago
Question
Answered: 1 week ago
Question
Answered: 1 week ago
Question
Answered: 1 week ago
Question
Answered: 1 week ago
Question
Answered: 1 week ago
Question
Answered: 1 week ago
Question
Answered: 1 week ago
Question
Answered: 1 week ago
Question
Answered: 1 week ago
Question
Answered: 1 week ago
Question
Answered: 1 week ago
Question
Answered: 1 week ago
Question
Answered: 1 week ago
Question
Answered: 1 week ago
Question
Answered: 1 week ago
Question
Answered: 1 week ago
Question
Answered: 1 week ago
Question
Answered: 1 week ago
Question
Answered: 1 week ago
Question
Answered: 1 week ago
View Answer in SolutionInn App


