Answered step by step
Verified Expert Solution
Question
1 Approved Answer
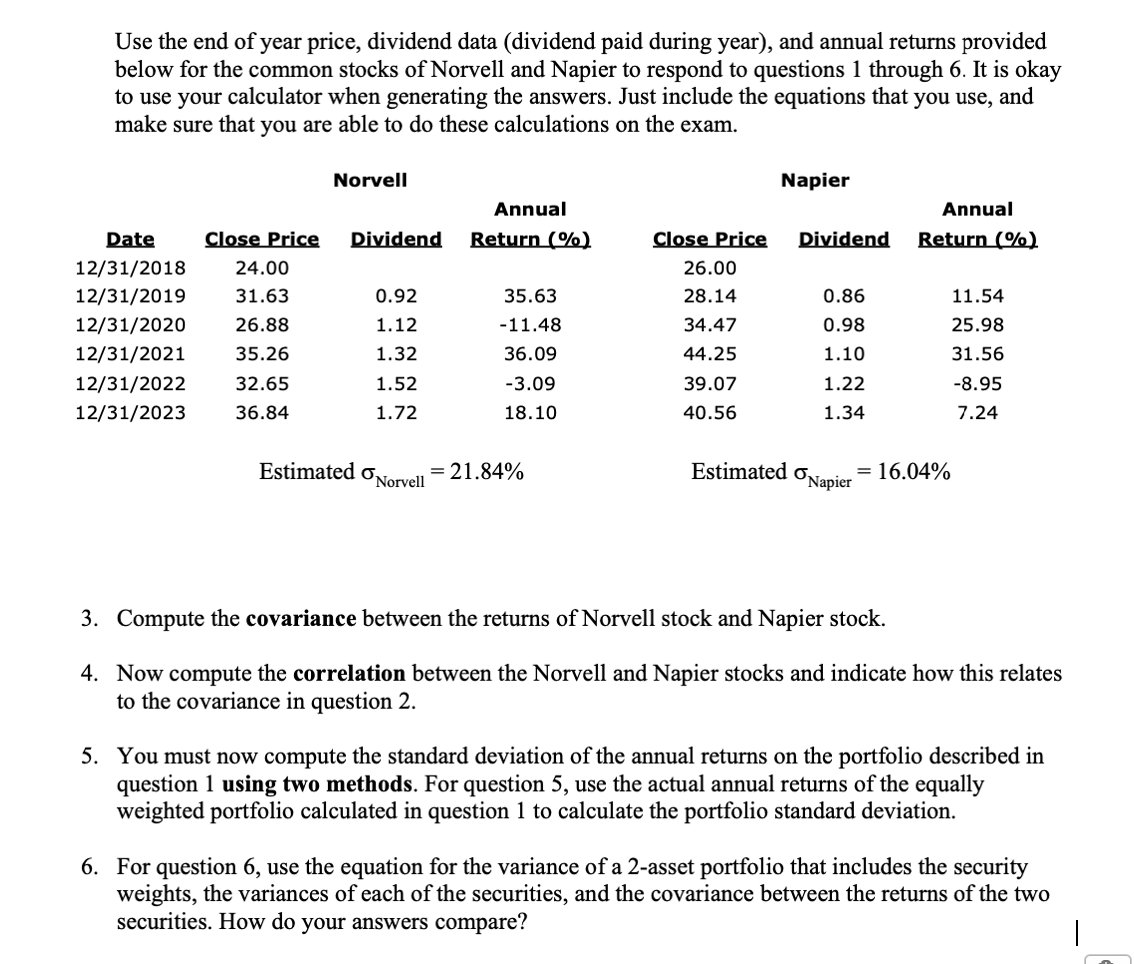
Use the end of year price, dividend data ( dividend paid during year ) , and annual returns provided below for the common stocks of
Use the end of year price, dividend data dividend paid during year and annual returns provided
below for the common stocks of Norvell and Napier to respond to questions through It is okay
to use your calculator when generating the answers. Just include the equations that you use, and
make sure that you are able to do these calculations on the exam.
Compute the covariance between the returns of Norvell stock and Napier stock.
Now compute the correlation between the Norvell and Napier stocks and indicate how this relates
to the covariance in question
You must now compute the standard deviation of the annual returns on the portfolio described in
question using two methods. For question use the actual annual returns of the equally
weighted portfolio calculated in question to calculate the portfolio standard deviation.
For question use the equation for the variance of a asset portfolio that includes the security
weights, the variances of each of the securities and the covariance between the returns of the two
securities How do your answers compare?

Step by Step Solution
There are 3 Steps involved in it
Step: 1

Get Instant Access to Expert-Tailored Solutions
See step-by-step solutions with expert insights and AI powered tools for academic success
Step: 2

Step: 3

Ace Your Homework with AI
Get the answers you need in no time with our AI-driven, step-by-step assistance
Get Started


