Answered step by step
Verified Expert Solution
Link Copied!

Question

1 Approved Answer

Use the figure below to answer the following question. Price Quantity demanded (dollars per box) (thousands of boxes per week) 7.3 1000 10.4 900 13.6
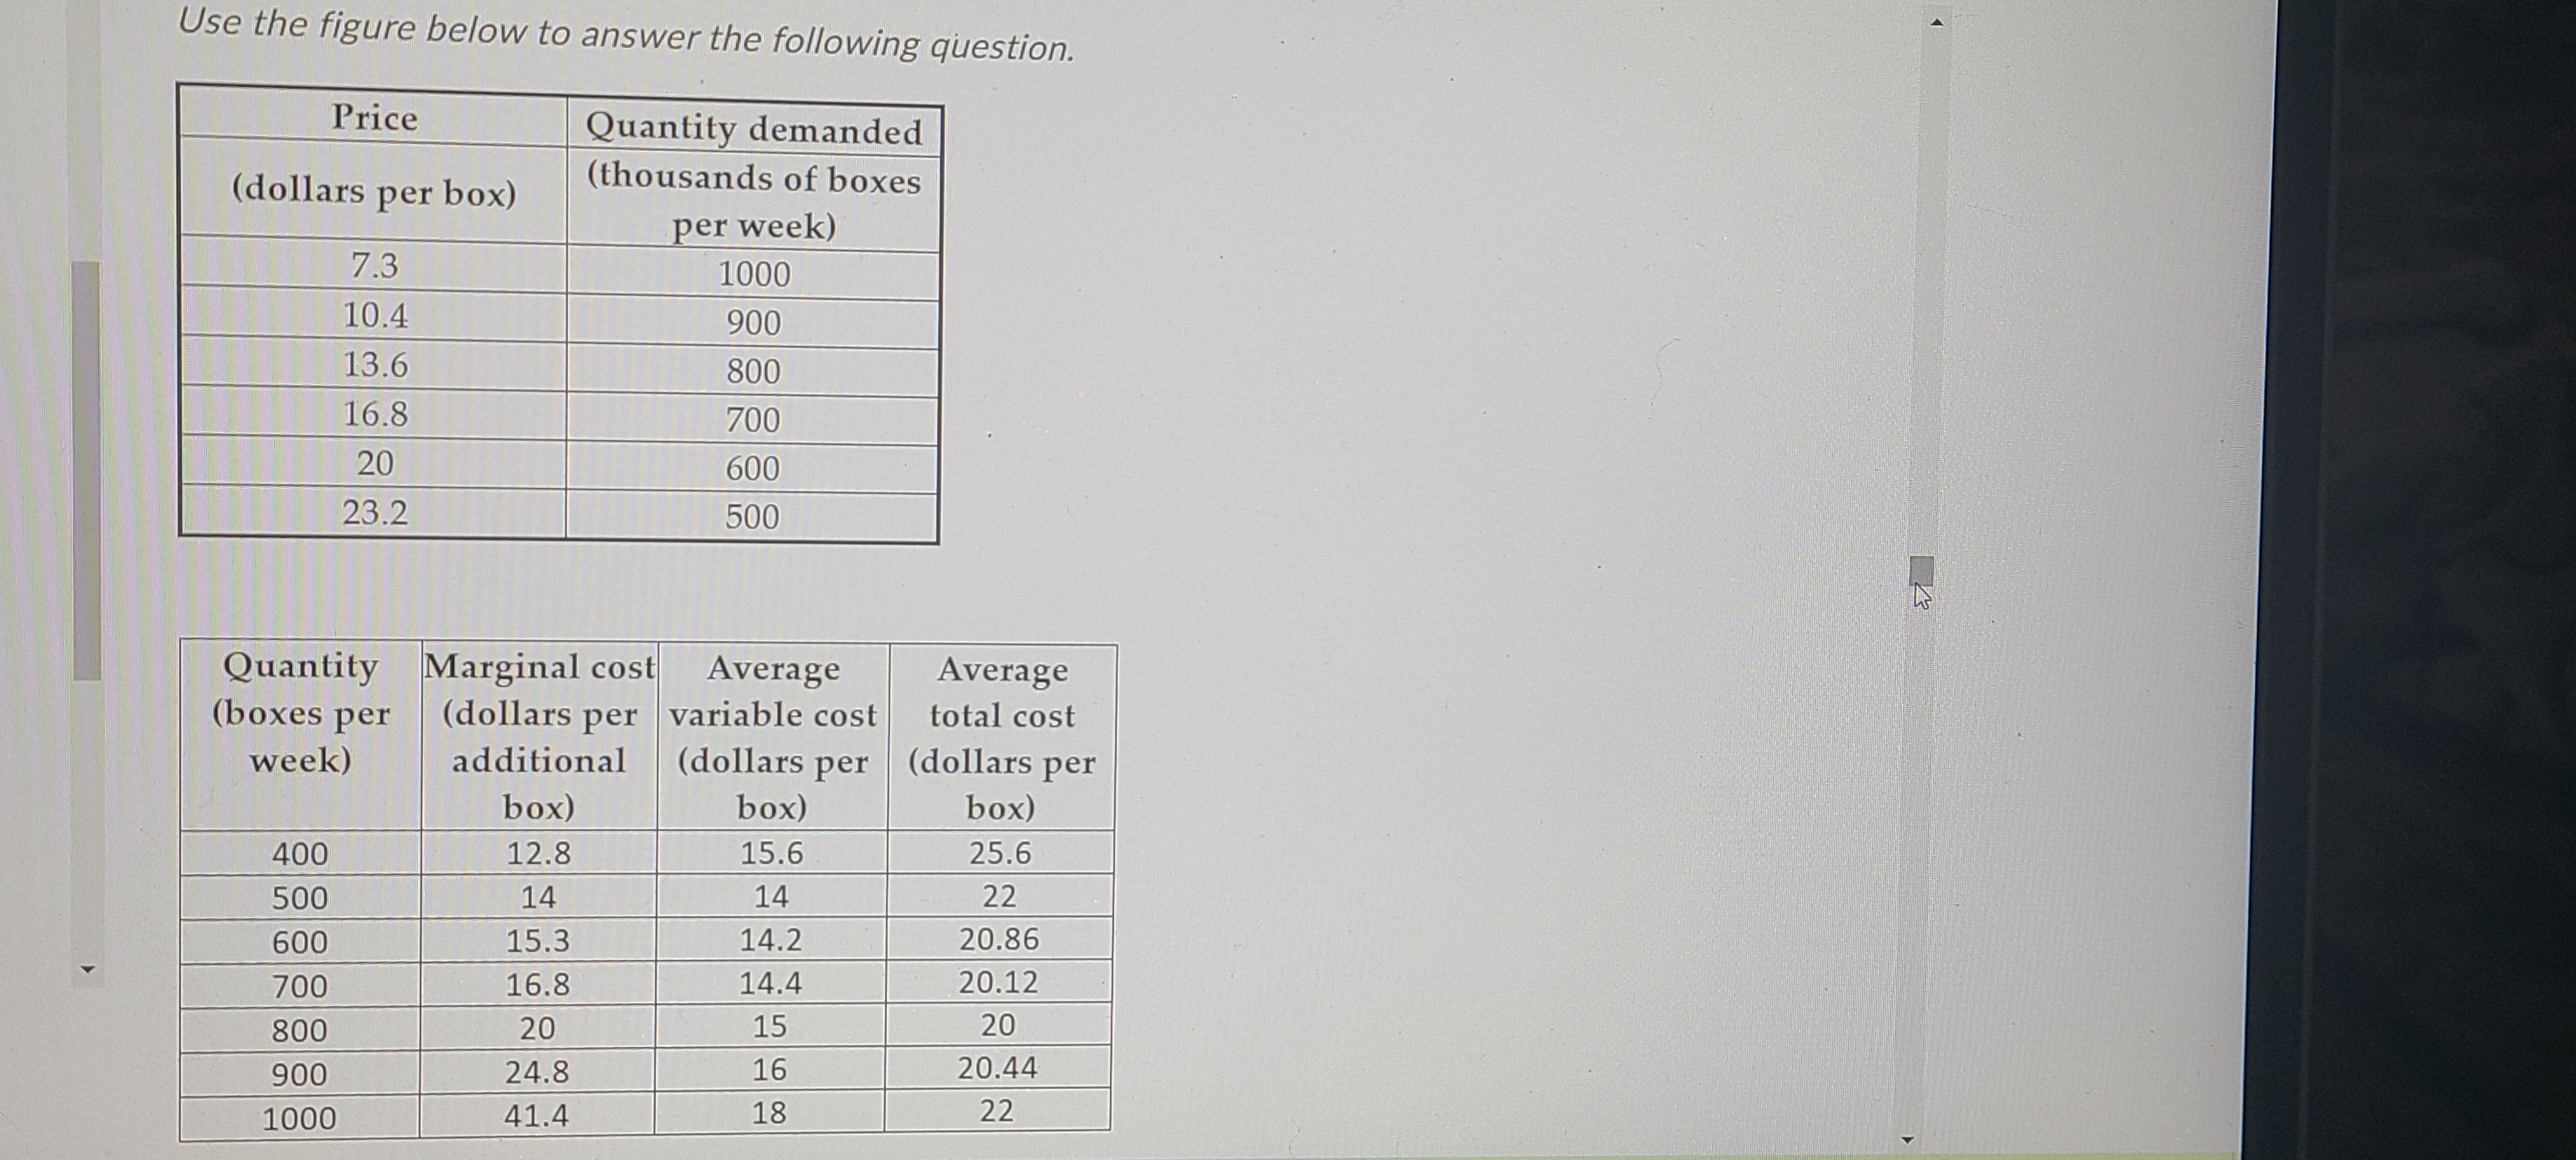
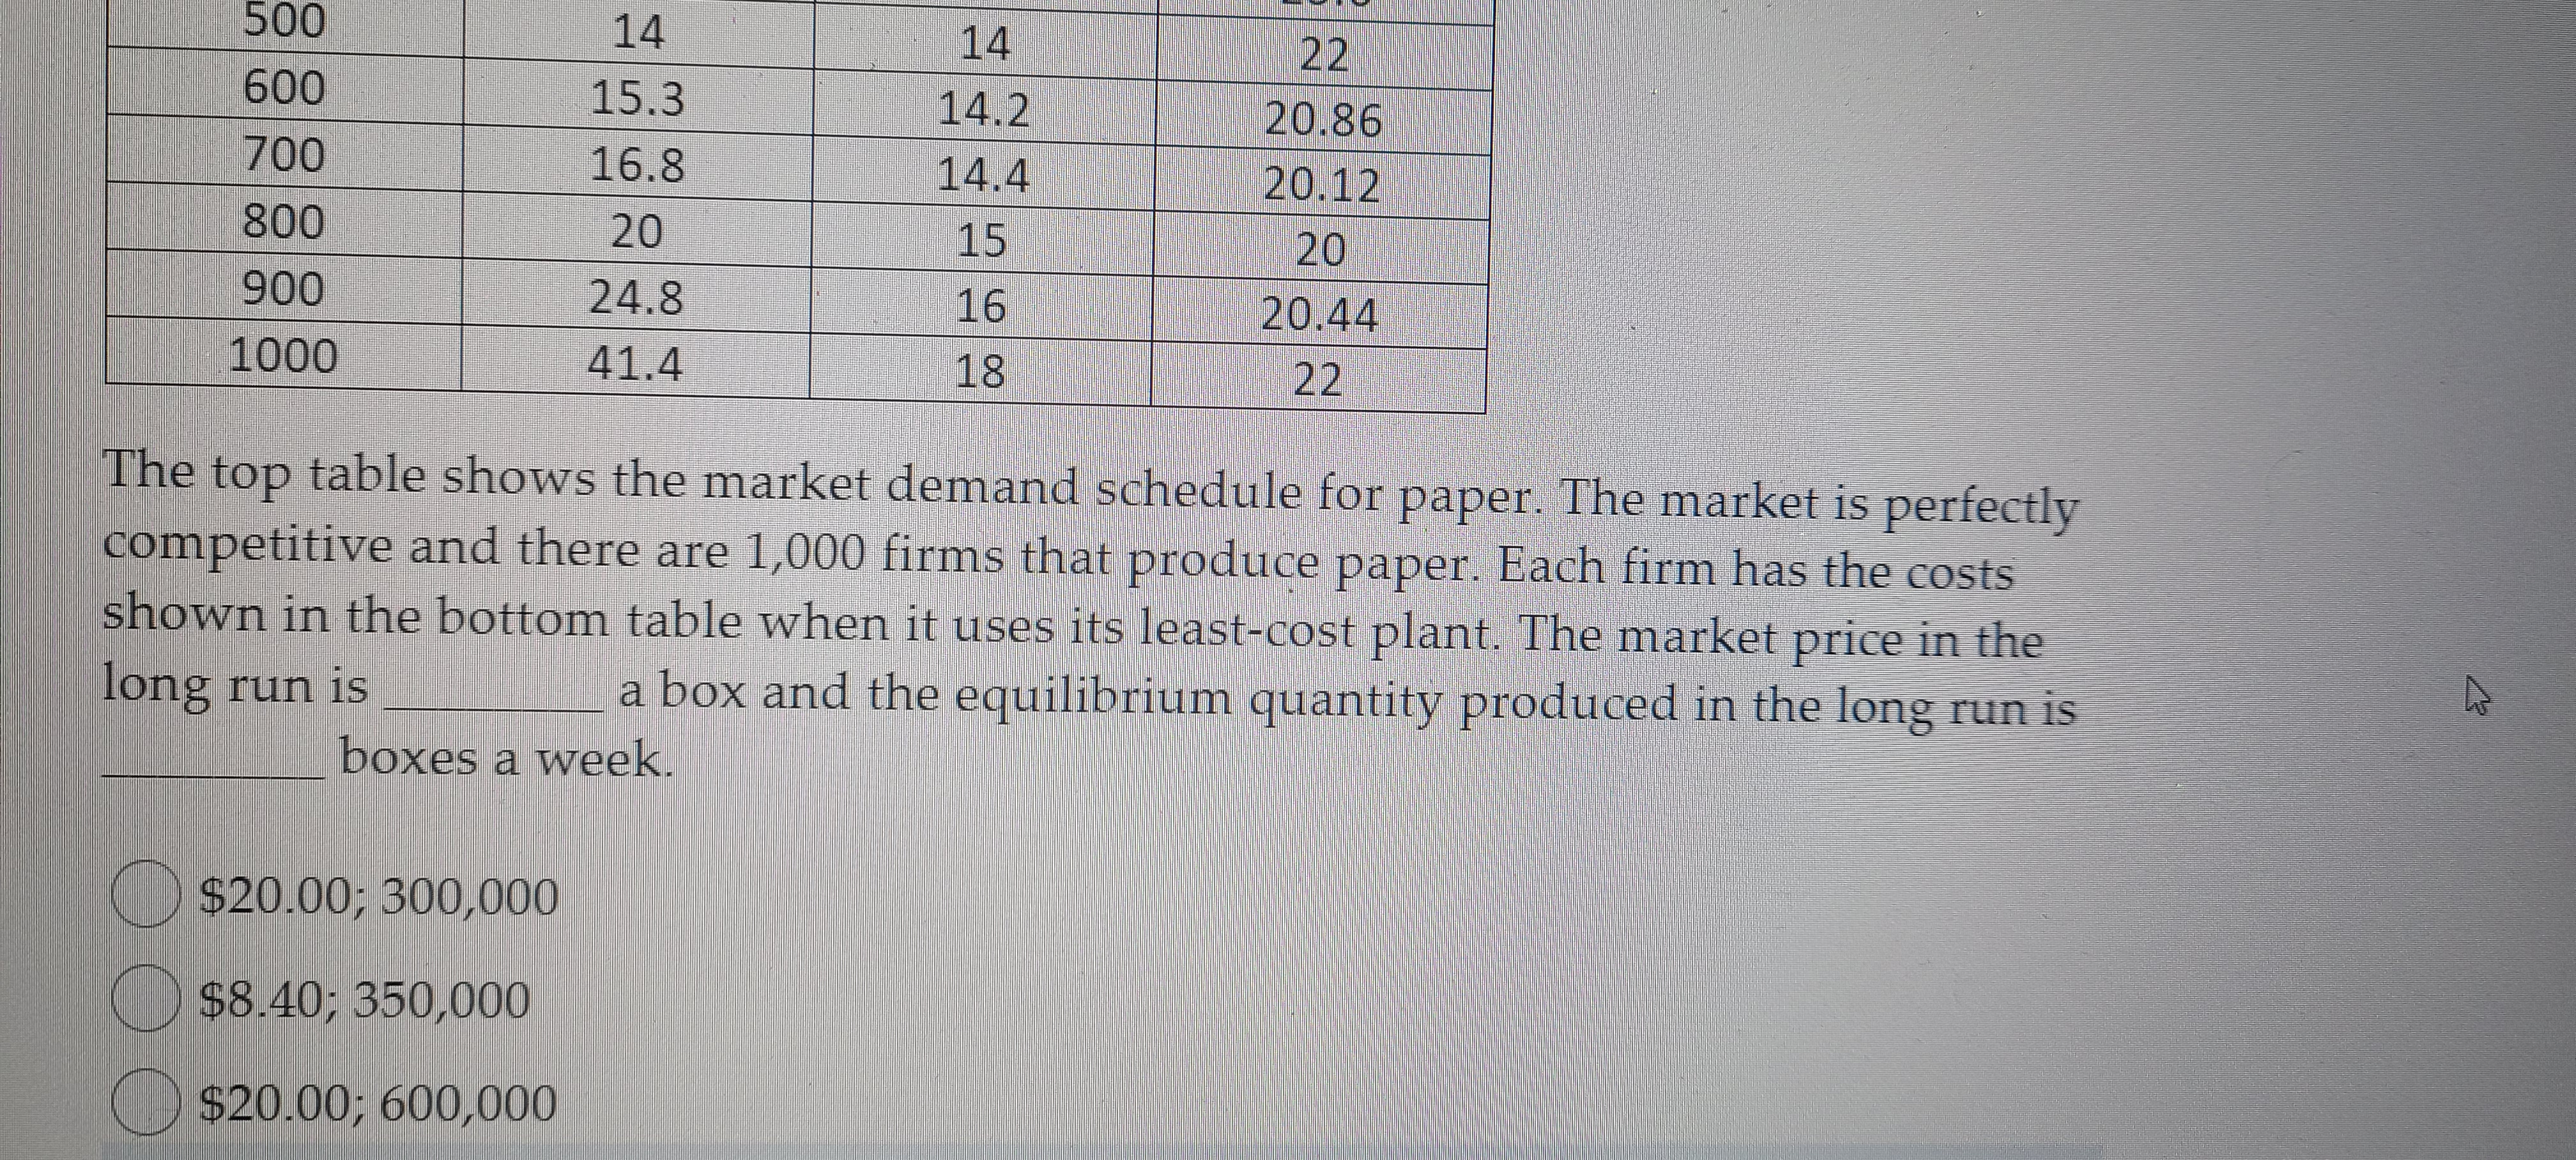
image text in transcribedimage text in transcribed
Use the figure below to answer the following question. Price Quantity demanded (dollars per box) (thousands of boxes per week) 7.3 1000 10.4 900 13.6 800 16.8 700 20 600 23.2 500 Quantity Marginal cost Average Average (boxes per (dollars per |variable cost total cost week) additional (dollars per (dollars per box) box) box) 400 12.8 15.6 25.6 500 14 14 22 600 15.3 14.2 20.86 700 16.8 14.4 20.12 800 20 15 20 900 24.8 16 20.44 1000 41.4 18 22500 14 14 22 600 15.3 14.2 20.86 700 16.8 14.4 20.12 800 20 15 20 900 24.8 16 20.44 1000 41.4 18 22 The top table shows the market demand schedule for paper. The market is perfectly competitive and there are 1,000 firms that produce paper. Each firm has the costs shown in the bottom table when it uses its least-cost plant. The market price in the long run is a box and the equilibrium quantity produced in the long run is boxes a week. O $20.00; 300,000 $8.40: 350,000 $20.00; 600,000

Step by Step Solution

There are 3 Steps involved in it

Step: 1

blur-text-image

Get Instant Access to Expert-Tailored Solutions

See step-by-step solutions with expert insights and AI powered tools for academic success

Step: 2

blur-text-image

Step: 3

blur-text-image

Ace Your Homework with AI

Get the answers you need in no time with our AI-driven, step-by-step assistance

Get Started

Recommended Textbook for

Using R For Econometrics

Authors: Florian Heiss

1st Edition

1523285133, 9781523285136

More Books

Students also viewed these Economics questions

Question

Conduct a needs assessment. page 269

Answered: 1 week ago