Answered step by step
Verified Expert Solution
Question
1 Approved Answer
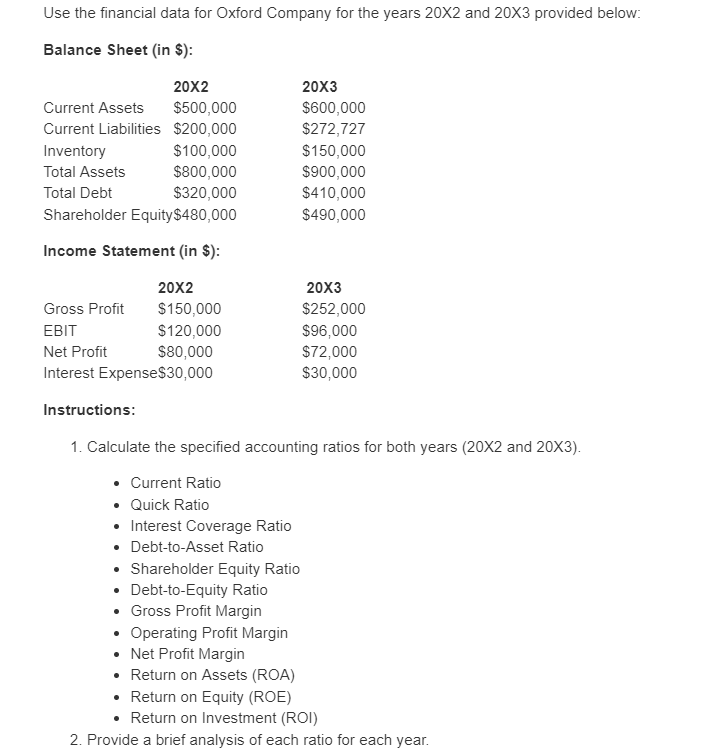
Use the financial data for Oxford Company for the years 20X2 and 20X3 provided below: Balance Sheet (in $): 20X2 20X3 Current Assets $500,000


Use the financial data for Oxford Company for the years 20X2 and 20X3 provided below: Balance Sheet (in $): 20X2 20X3 Current Assets $500,000 $600,000 Current Liabilities $200,000 $272,727 Inventory $100,000 $150,000 Total Assets $800,000 $900,000 Total Debt $320,000 $410,000 Shareholder Equity $480,000 $490,000 Income Statement (in $): 20X2 20X3 Gross Profit $150,000 $252,000 EBIT $120,000 $96,000 Net Profit $80,000 $72,000 $30,000 Interest Expense$30,000 Instructions: 1. Calculate the specified accounting ratios for both years (20X2 and 20X3). Current Ratio Quick Ratio Interest Coverage Ratio Debt-to-Asset Ratio Shareholder Equity Ratio Debt-to-Equity Ratio Gross Profit Margin Operating Profit Margin Net Profit Margin Return on Assets (ROA) Return on Equity (ROE) Return on Investment (ROI) 2. Provide a brief analysis of each ratio for each year. 3. Discuss any notable trends or changes observed between the two years. 4. Based on your analysis, identify potential areas of strength or concern for Company XYZ. 5. Suggest possible strategies or actions the company could take to address any identified issues. Note: Show all calculations and provide concise and insightful explanations for your analysis.
Step by Step Solution
There are 3 Steps involved in it
Step: 1

Get Instant Access to Expert-Tailored Solutions
See step-by-step solutions with expert insights and AI powered tools for academic success
Step: 2

Step: 3

Ace Your Homework with AI
Get the answers you need in no time with our AI-driven, step-by-step assistance
Get Started


