Question
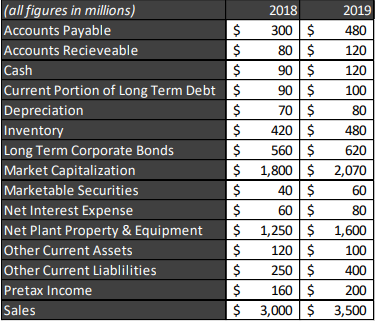
Use the financial information about Widget Co. below to help answer questions In 2019, Widget Co. did not issue (or repurchase) any shares of stock;
Use the financial information about Widget Co. below to help answer questions
In 2019, Widget Co. did not issue (or repurchase) any shares of stock;
o Put differently, shares outstanding was the same in both 2018 and 2019
Widget Co. has a retention ratio of 1.00
Widget Co. has an effective tax rate of 25%


There are many similar companies that compete with Widget Co. The industrys valuation multiples are below:

It is recommended you carefully reconstruct an income statement and balance sheet before attempting these problems.
1.First, calculate P/S, P/B, P/E for Widget Co. in 2019. Next, compare your calculations to the industry multiples provided.
Which of the following statements is most likely TRUE:
I. Based on P/S, Widget Co.s is a better value than the average company in the industry
II. Based on P/E, Widget Co.s is a better value than the average company in the industry
III. Based on P/B, Widget Co.s is a more expensive than the average company in the industry
a. I b. II c. III d. I,III e. All of the statements
2.Which of the following methods (I,II,II) would be an appropriate way to value Widget Co:
I. Dividend Discount Model
II. Free Cash Flow Model
III. Comparable Multiples (e.g. P/S, P/B, P/E vs. Industry)
a) I b) III c) I,III d) II,III e) All of the methods
3.In 2019, Investment in Working Capital is closest to:
HINT: Don NOT include Marketable Securities or Current Portion of LT Debt
a. ($240) b. ($200) c. ($140) d. $140 e. $200
(all figures in millions) 2018 2019 Accounts Payable $ 300 $ 480 Accounts Recieveable $ 80$ 120 Cash $ 90$ 120 Current Portion of Long Term Debt $ 90$ 100 Depreciation $ 70 $ 80 Inventory $ 420 $ 480 Long Term Corporate Bonds $ 560$ 620 Market Capitalization $ 1,800 $ 2,070 Marketable Securities $ 40 $ 60 Net Interest Expense $ 60 $ 80 Net Plant Property & Equipment $ 1,250 $ 1,600 Other Current Assets $ 120$ 100 Other Current Liablilities $ 250 $ 400 Pretax Income $ 160 $ 200 Sales $ 3,000$ 3,500 DuPont ROE Tax Burden Int Burden Operating Margin TA Turnover Leverage Ratio 2018 0.7500 0.7273 0.0733) 1.5000 2.5000 2019 0.7500 0.7143 0.0800 1.3725) 2.6842 Industry Valuation Multiples Price to Sales Price to Book Price to Earnings 2019 5.0 3.0 20.0 (all figures in millions) 2018 2019 Accounts Payable $ 300 $ 480 Accounts Recieveable $ 80$ 120 Cash $ 90$ 120 Current Portion of Long Term Debt $ 90$ 100 Depreciation $ 70 $ 80 Inventory $ 420 $ 480 Long Term Corporate Bonds $ 560$ 620 Market Capitalization $ 1,800 $ 2,070 Marketable Securities $ 40 $ 60 Net Interest Expense $ 60 $ 80 Net Plant Property & Equipment $ 1,250 $ 1,600 Other Current Assets $ 120$ 100 Other Current Liablilities $ 250 $ 400 Pretax Income $ 160 $ 200 Sales $ 3,000$ 3,500 DuPont ROE Tax Burden Int Burden Operating Margin TA Turnover Leverage Ratio 2018 0.7500 0.7273 0.0733) 1.5000 2.5000 2019 0.7500 0.7143 0.0800 1.3725) 2.6842 Industry Valuation Multiples Price to Sales Price to Book Price to Earnings 2019 5.0 3.0 20.0
Step by Step Solution
There are 3 Steps involved in it
Step: 1

Get Instant Access to Expert-Tailored Solutions
See step-by-step solutions with expert insights and AI powered tools for academic success
Step: 2

Step: 3

Ace Your Homework with AI
Get the answers you need in no time with our AI-driven, step-by-step assistance
Get Started


