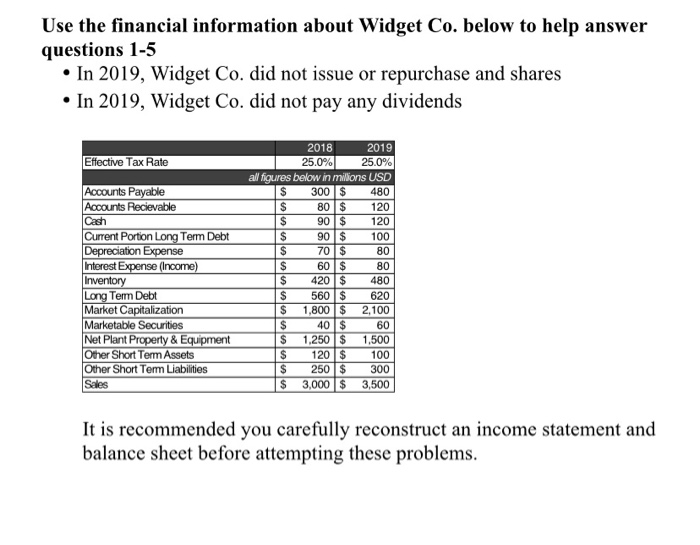
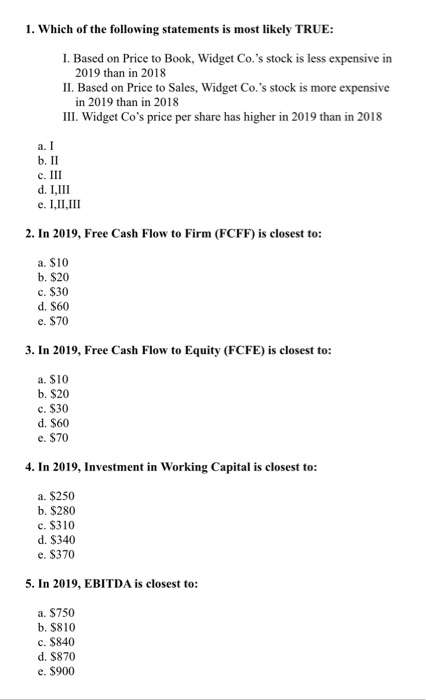
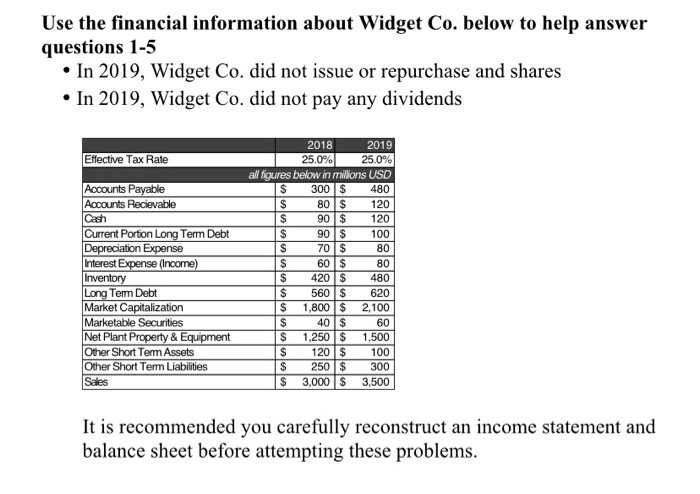
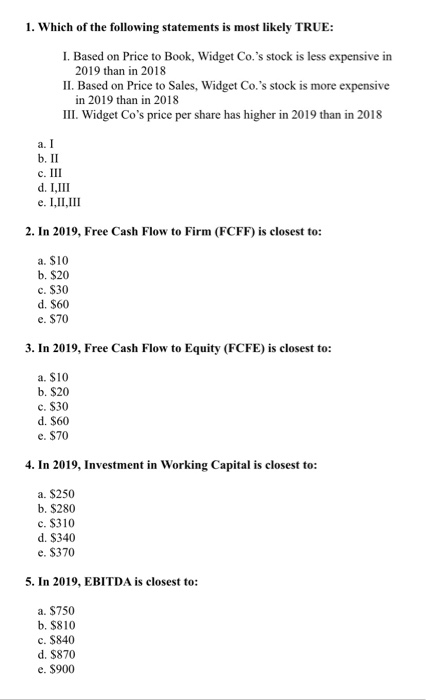
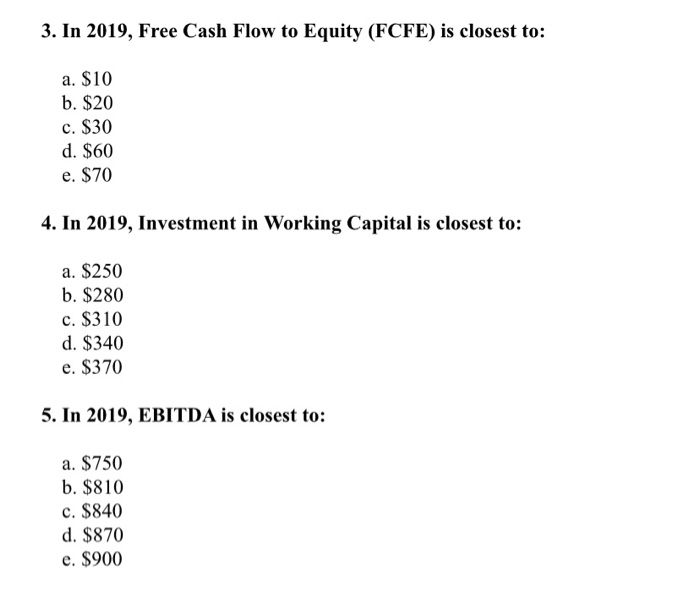
Use the financial information about Widget Co. below to help answer questions 1-5 In 2019, Widget Co. did not issue or repurchase and shares In 2019, Widget Co. did not pay any dividends Effective Tax Rate Accounts Payable Accounts Recievable Cash Current Portion Long Term Debt Depreciation Expense Interest Expense (Income) Inventory Long Term Debt Market Capitalization Marketable Securities Net Plant Property & Equipment Other Short Term Assets Other Short Term Liabilities Sales 2018 2019 25.0% 25.0% all figures below in millions USD $ 300 $ 480 $ 80 $ 120 $ 90 $ 120 $ 90 $ 100 $ 70 $ 80 IS 60 $ 80 $ 420 $ 480 $ 560 $ 620 $ 1,800 $ 2,100 $ 40 $ 60 $ 1,250 $ 1.500 $ 120 $ 100 $ 250 $ 300 $ 3,000 $ 3,500 It is recommended you carefully reconstruct an income statement and balance sheet before attempting these problems. 1. Which of the following statements is most likely TRUE: I. Based on Price to Book, Widget Co.'s stock is less expensive in 2019 than in 2018 II. Based on Price to Sales, Widget Co.'s stock is more expensive in 2019 than in 2018 III. Widget Co's price per share has higher in 2019 than in 2018 a. I b. II c. III d. I,III e. I,II,III 2. In 2019, Free Cash Flow to Firm (FCFF) is closest to: a. $10 b. $20 c. $30 d. $60 e. $70 3. In 2019, Free Cash Flow to Equity (FCFE) is closest to: a. SIO b. $20 c. $30 d. $60 e. $70 4. In 2019, Investment in Working Capital is closest to: a. S250 b. $280 c. $310 d. $340 e. S370 5. In 2019, EBITDA is closest to: a. $750 b. $810 c. S840 d. $870 e. $900 Use the financial information about Widget Co. below to help answer questions 1-5 In 2019, Widget Co. did not issue or repurchase and shares In 2019, Widget Co. did not pay any dividends Effective Tax Rate s Accounts Payable Accounts Recievable Cash Current Portion Long Term Debt Depreciation Expense Interest Expense (Income) Inventory Long Term Debt Market Capitalization Marketable Securities Net Plant Property & Equipment Other Short Term Assets Other Short Term Liabilities Sales 2018 2019 25.0% 25.0% all figures below in millions USD $ 300 $ 480 $ 80 $ 120 $ 90 $ 120 $ 90 $ 100 70 $ 80 $ 60 $ 80 $ 420 $ 480 $ 560 $ 620 $ 1,800 $ 2,100 $ 40 $ 60 1,250 $ 1,500 $ 120 $ 100 $ 250 $ 300 $ 3,000 $ 3,500 It is recommended you carefully reconstruct an income statement and balance sheet before attempting these problems. 1. Which of the following statements is most likely TRUE: I. Based on Price to Book, Widget Co.'s stock is less expensive in 2019 than in 2018 II. Based on Price to Sales, Widget Co.'s stock is more expensive in 2019 than in 2018 III. Widget Co's price per share has higher in 2019 than in 2018 a. I b. II c. III d. I,III e. I,II,III 2. In 2019, Free Cash Flow to Firm (FCFF) is closest to: a. $10 b. $20 c. $30 d. $60 e. $70 3. In 2019, Free Cash Flow to Equity (FCFE) is closest to: a. SIO b. $20 c. S30 d. $60 e. $70 4. In 2019, Investment in Working Capital is closest to: a. $250 b. $280 c. $310 d. $340 e. S370 5. In 2019, EBITDA is closest to: a. $750 b. $810 c. S840 d. $870 e. $900 3. In 2019, Free Cash Flow to Equity (FCFE) is closest to: a. $10 b. $20 c. $30 d. $60 e. $70 4. In 2019, Investment in Working Capital is closest to: a. $250 b. $280 c. $310 d. $340 e. $370 5. In 2019, EBITDA is closest to: a. $750 b. $810 c. $840 d. $870 e. $900 Use the financial information about Widget Co. below to help answer questions 1-5 In 2019, Widget Co. did not issue or repurchase and shares In 2019, Widget Co. did not pay any dividends Effective Tax Rate Accounts Payable Accounts Recievable Cash Current Portion Long Term Debt Depreciation Expense Interest Expense (Income) Inventory Long Term Debt Market Capitalization Marketable Securities Net Plant Property & Equipment Other Short Term Assets Other Short Term Liabilities Sales 2018 2019 25.0% 25.0% all figures below in millions USD $ 300 $ 480 $ 80 $ 120 $ 90 $ 120 $ 90 $ 100 $ 70 $ 80 IS 60 $ 80 $ 420 $ 480 $ 560 $ 620 $ 1,800 $ 2,100 $ 40 $ 60 $ 1,250 $ 1.500 $ 120 $ 100 $ 250 $ 300 $ 3,000 $ 3,500 It is recommended you carefully reconstruct an income statement and balance sheet before attempting these problems. 1. Which of the following statements is most likely TRUE: I. Based on Price to Book, Widget Co.'s stock is less expensive in 2019 than in 2018 II. Based on Price to Sales, Widget Co.'s stock is more expensive in 2019 than in 2018 III. Widget Co's price per share has higher in 2019 than in 2018 a. I b. II c. III d. I,III e. I,II,III 2. In 2019, Free Cash Flow to Firm (FCFF) is closest to: a. $10 b. $20 c. $30 d. $60 e. $70 3. In 2019, Free Cash Flow to Equity (FCFE) is closest to: a. SIO b. $20 c. $30 d. $60 e. $70 4. In 2019, Investment in Working Capital is closest to: a. S250 b. $280 c. $310 d. $340 e. S370 5. In 2019, EBITDA is closest to: a. $750 b. $810 c. S840 d. $870 e. $900 Use the financial information about Widget Co. below to help answer questions 1-5 In 2019, Widget Co. did not issue or repurchase and shares In 2019, Widget Co. did not pay any dividends Effective Tax Rate s Accounts Payable Accounts Recievable Cash Current Portion Long Term Debt Depreciation Expense Interest Expense (Income) Inventory Long Term Debt Market Capitalization Marketable Securities Net Plant Property & Equipment Other Short Term Assets Other Short Term Liabilities Sales 2018 2019 25.0% 25.0% all figures below in millions USD $ 300 $ 480 $ 80 $ 120 $ 90 $ 120 $ 90 $ 100 70 $ 80 $ 60 $ 80 $ 420 $ 480 $ 560 $ 620 $ 1,800 $ 2,100 $ 40 $ 60 1,250 $ 1,500 $ 120 $ 100 $ 250 $ 300 $ 3,000 $ 3,500 It is recommended you carefully reconstruct an income statement and balance sheet before attempting these problems. 1. Which of the following statements is most likely TRUE: I. Based on Price to Book, Widget Co.'s stock is less expensive in 2019 than in 2018 II. Based on Price to Sales, Widget Co.'s stock is more expensive in 2019 than in 2018 III. Widget Co's price per share has higher in 2019 than in 2018 a. I b. II c. III d. I,III e. I,II,III 2. In 2019, Free Cash Flow to Firm (FCFF) is closest to: a. $10 b. $20 c. $30 d. $60 e. $70 3. In 2019, Free Cash Flow to Equity (FCFE) is closest to: a. SIO b. $20 c. S30 d. $60 e. $70 4. In 2019, Investment in Working Capital is closest to: a. $250 b. $280 c. $310 d. $340 e. S370 5. In 2019, EBITDA is closest to: a. $750 b. $810 c. S840 d. $870 e. $900 3. In 2019, Free Cash Flow to Equity (FCFE) is closest to: a. $10 b. $20 c. $30 d. $60 e. $70 4. In 2019, Investment in Working Capital is closest to: a. $250 b. $280 c. $310 d. $340 e. $370 5. In 2019, EBITDA is closest to: a. $750 b. $810 c. $840 d. $870 e. $900