

Answered step by step
Verified Expert Solution
Question
1 Approved Answer
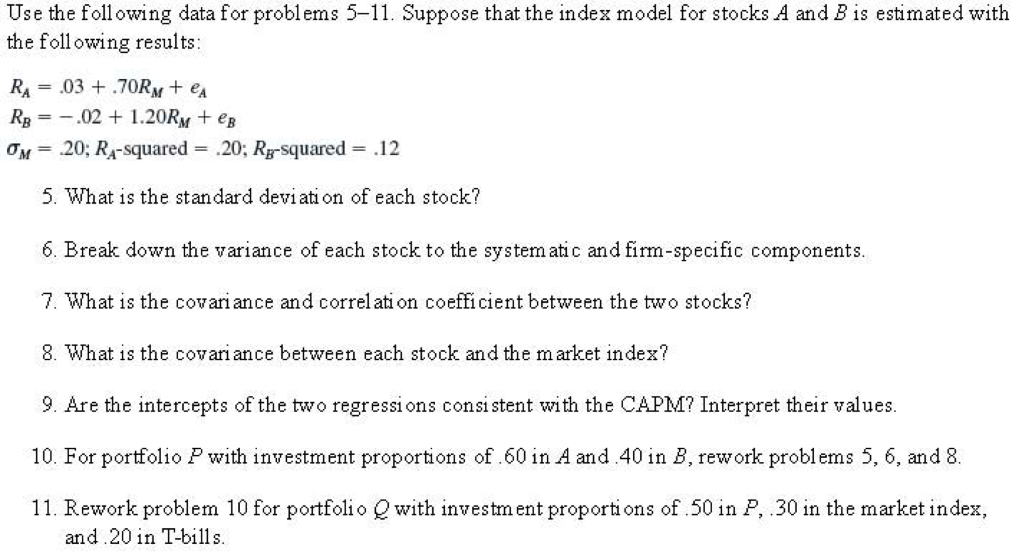
Use the following data for problems 5-11. Suppose that the index model for stocks A and B is estimated with the following results: R_A =
Step by Step Solution
There are 3 Steps involved in it
Step: 1

Get Instant Access to Expert-Tailored Solutions
See step-by-step solutions with expert insights and AI powered tools for academic success
Step: 2

Step: 3
Ace Your Homework with AI
Get the answers you need in no time with our AI-driven, step-by-step assistance
Get Started
The Option Trader Handbook
Authors: George Jabbour
2nd Edition
0470481617, 978-0470481615