

Answered step by step
Verified Expert Solution
Question
1 Approved Answer
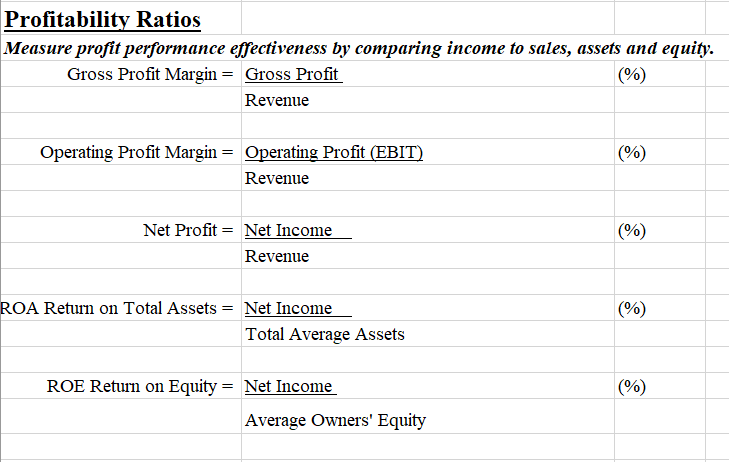
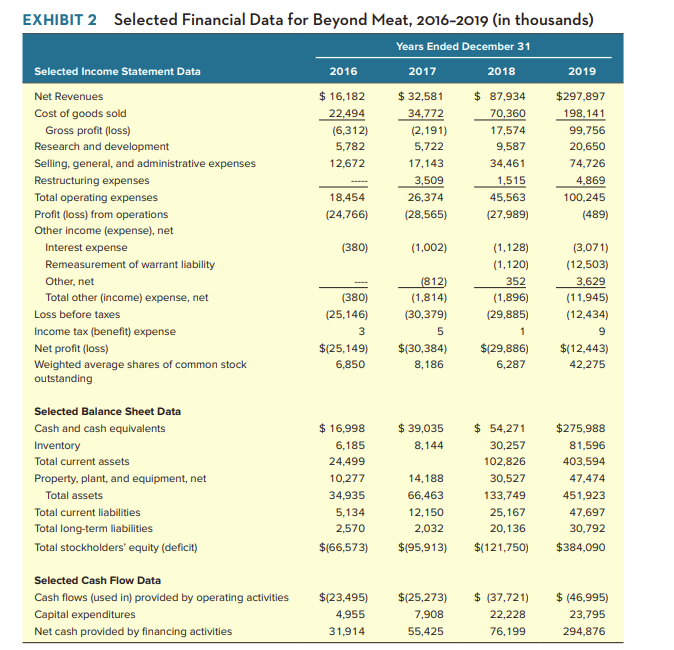
Use the following formulas to calculate each profitability ratio for each year on the financial statements for each year (years 2016-2019) Profitability Ratios Measure profit
Use the following formulas to calculate each profitability ratio for each year on the financial statements for each year (years 2016-2019)
Step by Step Solution
There are 3 Steps involved in it
Step: 1

Get Instant Access to Expert-Tailored Solutions
See step-by-step solutions with expert insights and AI powered tools for academic success
Step: 2

Step: 3
Ace Your Homework with AI
Get the answers you need in no time with our AI-driven, step-by-step assistance
Get Started
If Youre So Smart Why Arent You Rich A Guide To Investing Fundamentals
Authors: Ben S. Branch
1st Edition
0275990281, 978-0275990282