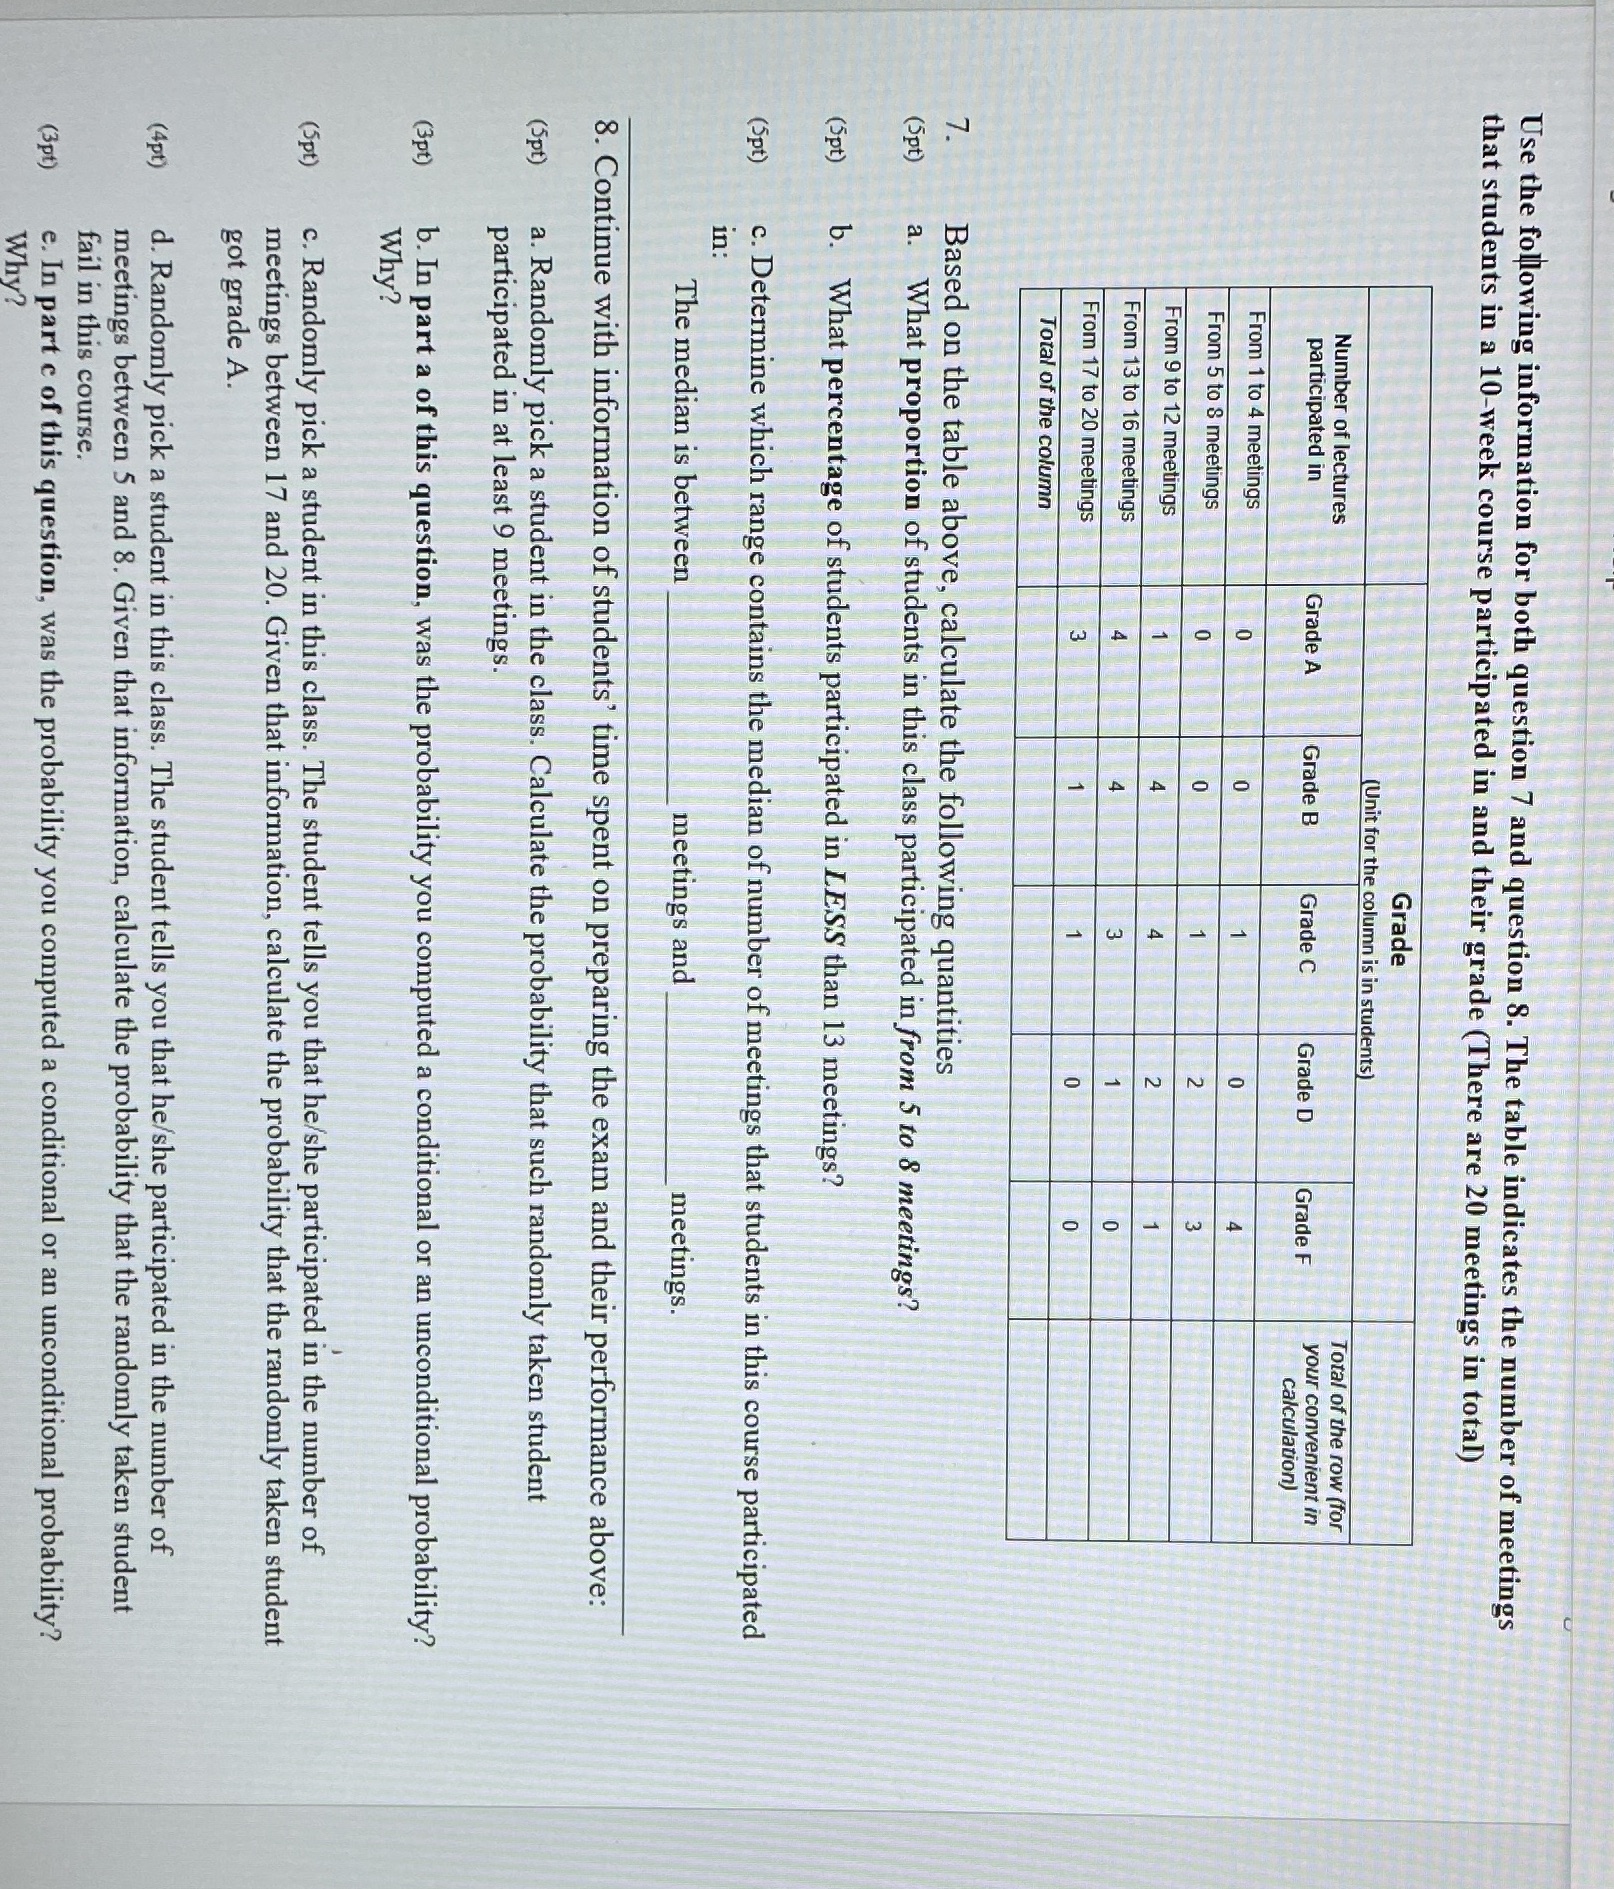
Use the following information for both question 7 and question S. The table indicates the number of meetings that students in a 10-week course participated in and their grade (There are 20 meetings in total) Grade (Unit for the column is in students) Number of lectures Total of the row (for participated in Grade A Grade B Grade C Grade D Grade F your convenient in calculation) From 1 to 4 meetings From 5 to S meetings O From 9 to 12 meetings N N T m TO O From 13 to 16 meetings + m - From 17 to 20 meetings Total of the column Based on the table above, calculate the following quantities (5pt) a. What proportion of students in this class participated in from 5 to 8 meetings? (5pt) b. What percentage of students participated in LESS than 13 meetings? (5pt) c. Determine which range contains the median of number of meetings that students in this course participated in: The median is between meetings and meetings. 8. Continue with information of students' time spent on preparing the exam and their performance above: (5pt) a. Randomly pick a student in the class. Calculate the probability that such randomly taken student participated in at least 9 meetings. (3pt) b. In part a of this question, was the probability you computed a conditional or an unconditional probability? Why? (5pt) c. Randomly pick a student in this class. The student tells you that he/she participated in the number of meetings between 17 and 20. Given that information, calculate the probability that the randomly taken student got grade A. (4pt ) d. Randomly pick a student in this class. The student tells you that he/she participated in the number of meetings between 5 and 8. Given that information, calculate the probability that the randomly taken student fail in this course. (3pt) e. In part c of this question, was the probability you computed a conditional or an unconditional probability? Why