Answered step by step
Verified Expert Solution
Question
1 Approved Answer
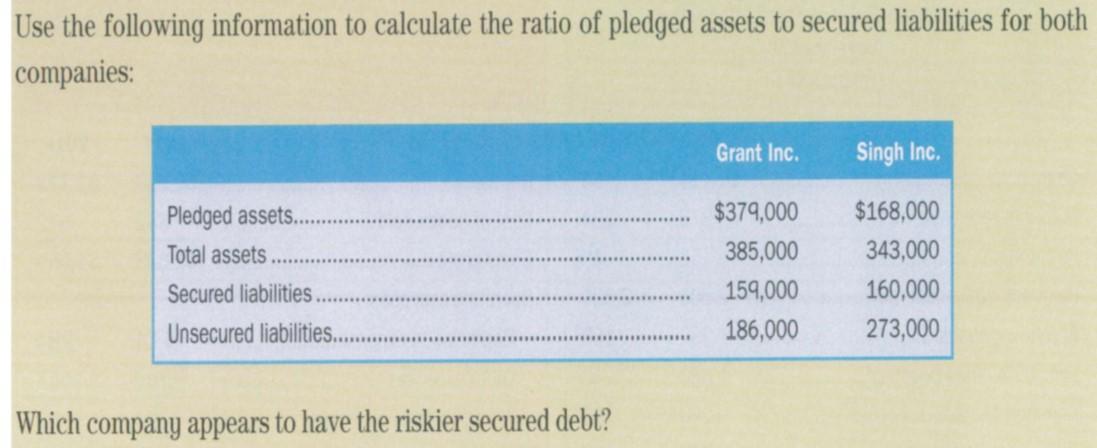
Use the following information to calculate the ratio of pledged assets to secured liabilities for both companies: Grant Inc. Singh Inc. Pledged assets.. Total
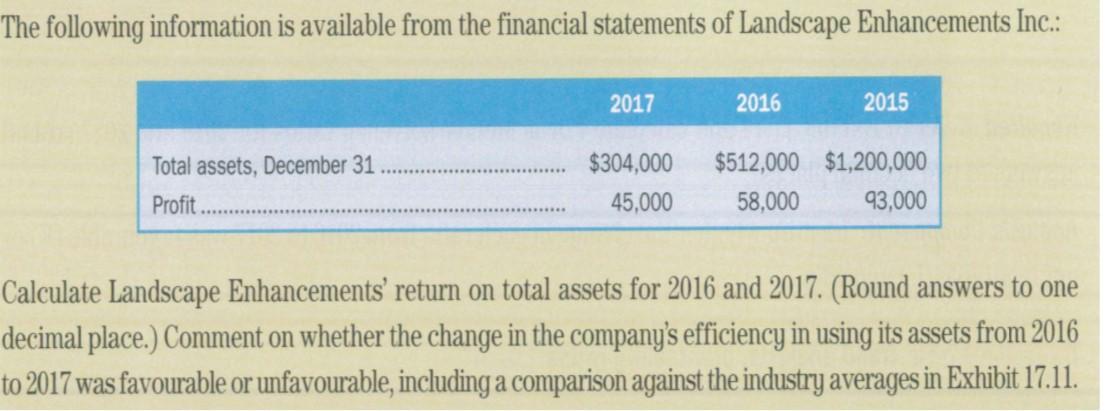
Use the following information to calculate the ratio of pledged assets to secured liabilities for both companies: Grant Inc. Singh Inc. Pledged assets.. Total assets. $379,000 $168,000 385,000 343,000 Secured liabilities. 159,000 160,000 Unsecured liabilities. 186,000 273,000 Which company appears to have the riskier secured debt? The following information is available from the financial statements of Landscape Enhancements Inc.: Total assets, December 31 Profit.. 2017 2016 2015 $304,000 45,000 $512,000 $1,200,000 58,000 93,000 Calculate Landscape Enhancements' return on total assets for 2016 and 2017. (Round answers to one decimal place.) Comment on whether the change in the company's efficiency in using its assets from 2016 to 2017 was favourable or unfavourable, including a comparison against the industry averages in Exhibit 17.11. Spence Resources Inc.'s December 31 incomplete balance sheet information follows along with additional information: Accounts payable. 2017 2016 2015 $360,920 $210,700 137,900 December 31, 2017 2016 Accounts receivable, net.. Cash...... Common shares* Long-term notes payable 261,520 176,316 137,760 72,520 98,434 103,040 455,000 455,000 455,000 Common shares market price.. Annual cash dividends declared per share.. $30.00 $28.00 0.60 0.30
Step by Step Solution
★★★★★
3.41 Rating (160 Votes )
There are 3 Steps involved in it
Step: 1
Answer To calculate the ratio of pledged assets to secured liabilities for Grant Inc and Singh Inc w...
Get Instant Access to Expert-Tailored Solutions
See step-by-step solutions with expert insights and AI powered tools for academic success
Step: 2

Step: 3

Ace Your Homework with AI
Get the answers you need in no time with our AI-driven, step-by-step assistance
Get Started


