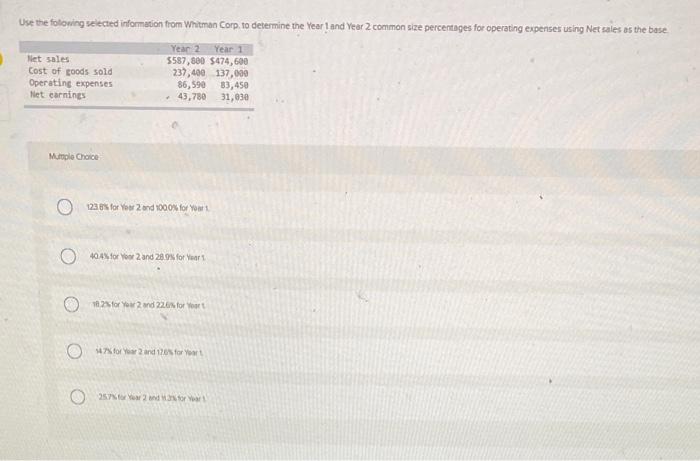
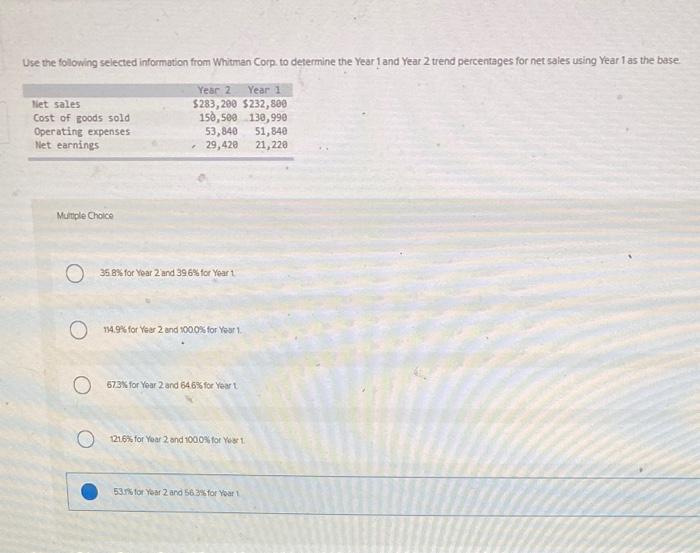
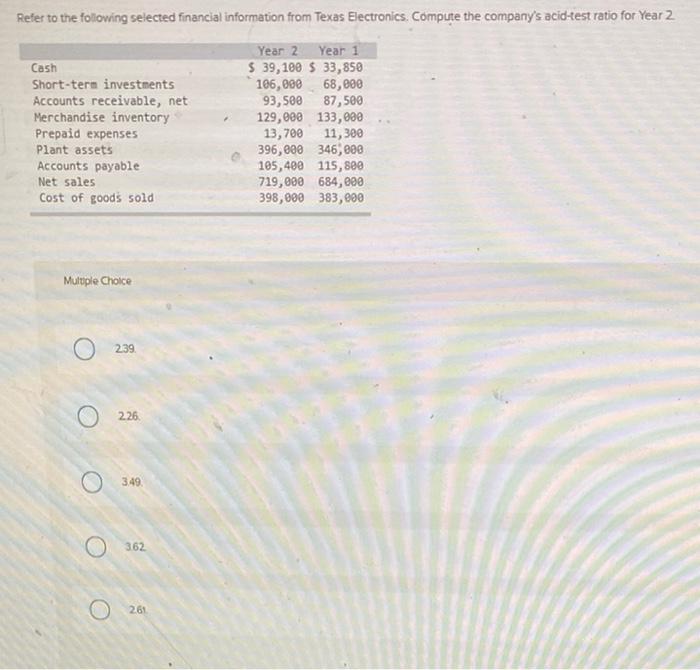
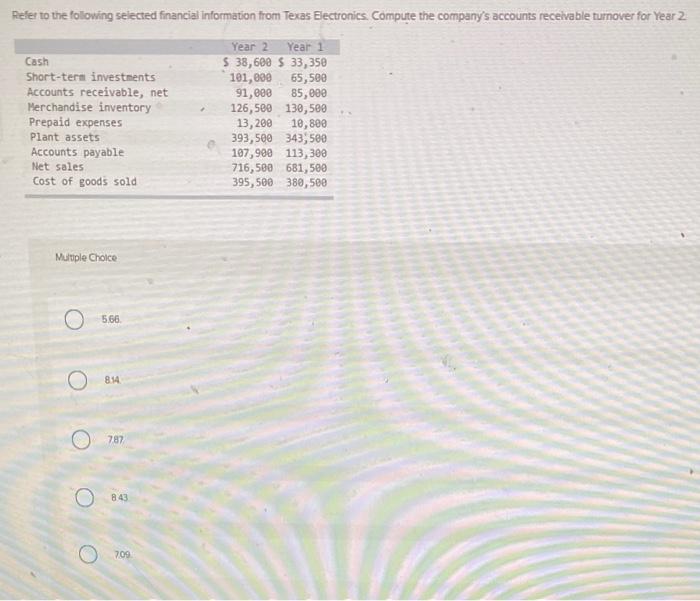
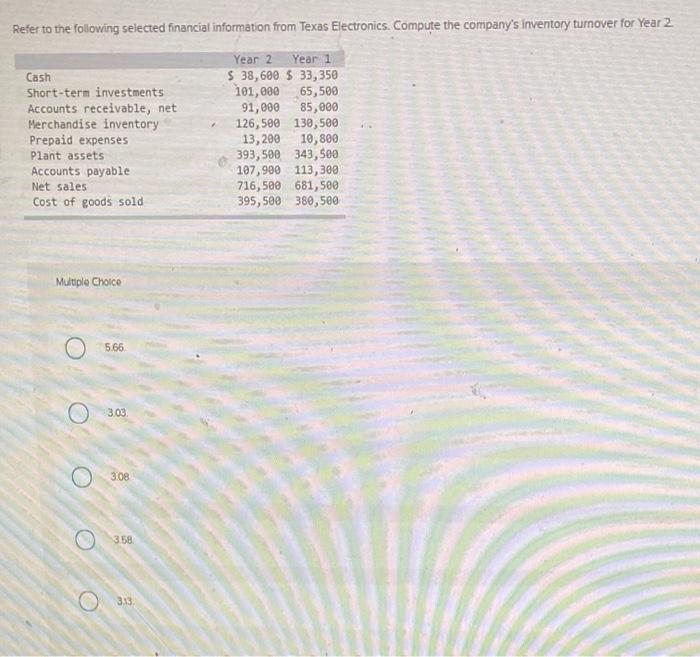
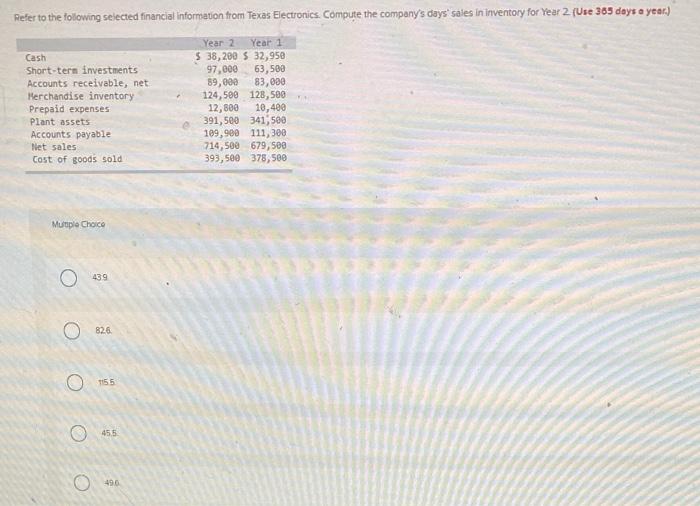
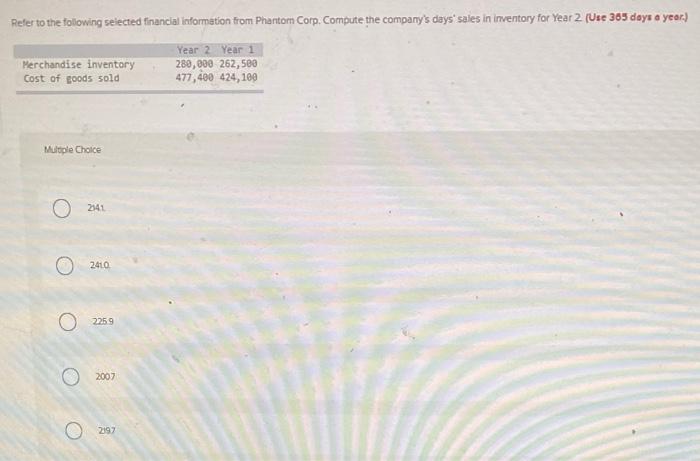
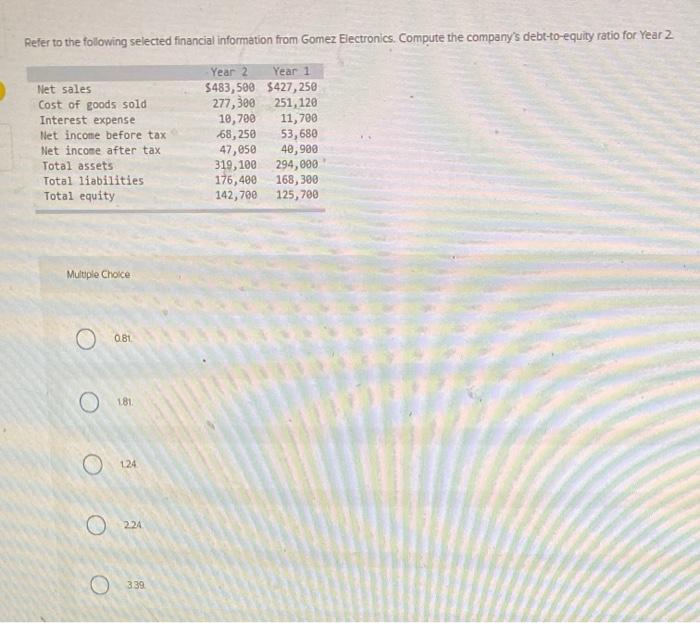
Use the following selected information from Whitman Corp. to determine the Year 1 and Year 2 common size percentages for operating expenses using Net sales as the base Net sales Cost of goods sold Operating expenses Het carnings Year 2 Year 1 5587,800 $474,600 237,400 137,000 86,590 33,450 43,780 31,930 Murple Choice 22 67% for Your Zond 1000% for Your 1 404 for Your 2 and 28.9.for at 23 for You 2 and 226x. for your 47% for Year 2 and 120 for Your : 27 won 1stor Use the following selected information from Whitman Corp. to determine the Year 1 and Year 2 trend percentages for net sales using Year 1 as the base liet sales Cost of goods sold Operating expenses Net earnings Year 2 Year 1 $283,200 $232,800 150,500 130,990 53,840 51,840 29,420 21, 228 Multiple Choice 0358for Year 2 and 396% tor Year 1 14.9% for Year 2 and 700.0% for Your 1 0673% for Your 2 and 646% for Year O 12.6% for Year 2 and 100.0for Your 1. 53.7% for Your 2 and 56 3% for Your Refer to the following selected financial information from Texas Electronics. Compute the company's acid-test ratio for Year 2 Cash Short-term investments Accounts receivable, net Merchandise inventory Prepaid expenses Plant assets Accounts payable Net sales Cost of goods sold Year 2 Year 1 $ 39,100 $ 33,850 106,080 68,000 93,500 87,500 129,00 133,000 13,700 11,300 396,000 346,000 105,400 115,880 719,000 684,000 398,000 383,000 Multiple Choice 0239 226 O 340 O 362 O261 Refer to the following selected financial Information from Texas Electronics Compute the company's accounts receivable turnover for Year 2 Cash Short-term investments Accounts receivable, net Merchandise inventory Prepaid expenses Plant assets Accounts payable Net sales Cost of goods sold Year 2 Year 1 $ 38,600 $ 33,350 101,000 65,500 91,000 85,000 126,500 130,500 13,200 10,800 393,500 343,500 107,900 113,300 716,580 681,500 395,500 380,500 Multiple Choice 0566 O 854 787 O 843 709 Refer to the following selected financial information from Texas Electronics Compute the company's Inventory turnover for Year 2 Cash Short-term investments Accounts receivable, net Merchandise inventory Prepaid expenses Plant assets Accounts payable Net sales Cost of goods sold Year 2 Year 1 $ 38,600 $ 33,350 101, 000 65,500 91,000 85,000 126,580 130,500 13,200 10,800 393,500 343,500 107,900 113,300 716,500 681,500 395,500 380,500 Multiple Choice O 5.66 03.03 o 308 3.58 Refer to the following selected financial information from Texas Electronics. Compute the company's days' sales in inventory for Year 2 (Use 365 dayt a year) Cash Short-term investments Accounts receivable, net Merchandise inventory Prepaid expenses Plant assets Accounts payable Niet sales Cost of goods sold Year 2 Year 1 $ 38,200 $ 32,950 97,000 63,500 89,000 83,000 124,580 128,500 12,800 10,400 391,500 341,500 109,900 111,300 714,500 679,500 393,500 378,500 Multiple Choice O 439 826 0 1155 0455 0496 Refer to the following selected financial information from Phantom Corp. Compute the company's days sales in inventory for Year 2 (Use 365 days a year) Merchandise inventory Cost of goods sold Year 2 Year 1 288,800 262,500 477,400 424,100 Multiple Choice 2141 O 2410 02259 2007 2007 Refer to the following selected financial information from Gomez Electronics. Compute the company's debt-to-equity ratio for Year 2 Net sales Cost of goods sold Interest expense Net income before tax Net income after tax Total assets Total liabilities Total equity Year 2 Year 1 $483,500 $427,258 277, 300 251,120 10,780 11,700 68,250 53,680 47,650 40,900 319, 100 294,000 176,400 168,300 142,700 125,700 Multiple Choice O 0.81 O 181 O 124 O 21 O o 339