Answered step by step
Verified Expert Solution
Question
1 Approved Answer
Use the format in the figure below to perform a financial analysis. Create a spreadsheet to perform the analysis and show the NPV, ROI, and
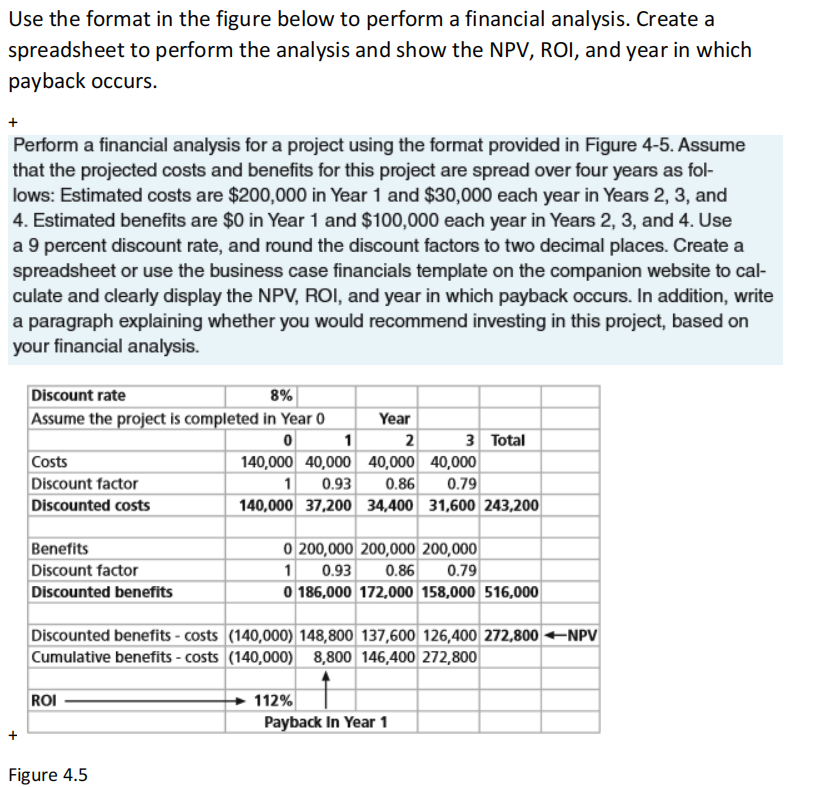
 Use the format in the figure below to perform a financial analysis. Create a spreadsheet to perform the analysis and show the NPV, ROI, and year in which payback occurs. Perform a financial analysis for a project using the format provided in Figure 4-5. Assume that the projected costs and benefits for this project are spread over four years as follows: Estimated costs are $200,000 in Year 1 and $30,000 each year in Years 2, 3, and 4. Estimated benefits are $0 in Year 1 and $100,000 each year in Years 2, 3, and 4. Use a 9 percent discount rate, and round the discount factors to two decimal places. Create a spreadsheet or use the business case financials template on the companion website to calculate and clearly display the NPV, ROI, and year in which payback occurs. In addition, write a paragraph explaining whether you would recommend investing in this project, based on your financial analysis. Figure 4.5
 Step by Step Solution
There are 3 Steps involved in it
Step: 1

Get Instant Access to Expert-Tailored Solutions
See step-by-step solutions with expert insights and AI powered tools for academic success
Step: 2

Step: 3

Ace Your Homework with AI
Get the answers you need in no time with our AI-driven, step-by-step assistance
Get Started


