Answered step by step
Verified Expert Solution
Link Copied!

Question

1 Approved Answer

Use the graph below to complete the answer. Please don't give me the same answer please. I have been getting the same answer. Question: Write

Use the graph below to complete the answer.

Please don't give me the same answer please. I have been getting the same answer.

Question: Write Investment essentials/ risks / financial ratio analysis for your company (Dexus) also analyse Dexus

Addresses the pros and cons of making an investment in the company. The analysis includes a thorough review of the cash flow, liquidity, capital structure or financial leverage of the business. Each ratio given below provides additional insight into the financial health of the company, and you will analyse how much these ratios changed over time.

o Liquidity ratios o Capital structure or financial leverage: Total debt ratio, long-term debt ratio, gearing (debt-to-equity ratio)

o Profitability ratios: Return on equity and return on assets

o Valuation: Calculating Net Tangible Assets (NTA) or Net Asset Value (NAV). REITPricing through premium/discount to NTAimage text in transcribed

Identifier (RIC) GPT.AX SGP.AX CQR.AX CDP.AX CMW.AX BWP.AX MGR.AX ABP.AX CQE.AX INA.AX DXS.AX APW.AX GMG.AX RNY.AX CHC.AX GOZ.AX Company Name Industry average GPT Group Stockland Corporation Ltd Charter Hall Retail REIT Carindale Property Trust Cromwell Property Group BWP Trust Mirvac Group Abacus Property Group Charter Hall Social Infrastructure REIT Ingenia Communities Group Dexus Aims Property Securities Fund Goodman Group RNY Property Trust Charter Hall Group Growthpoint Properties Australia Ltd Market Cap (USD) (=Avg) 1,524,937,136 4,303,901,612 3,734,029,487 896,786,927 115,572,552 1,221,227,431 1,236,065,832 5,062,345,022 940,119,168 407,930,992 538,827,580 6,042,869,433 29,916,785 13,517,905,378 799,459 2,080,864,174 1,203,966,508 ROE Common Equity %, TTM (FIO) (=Avg) 11.7% 8.2% 5.1% 3.7% 3.6% 11.3% 9.1% 10.2% 7.5% 9.1% 5.8% 13.5% 8.9% 14.3% 99.6% 20.7% 14.7% Curr Div Yield Comm Stk Primary, LFI, Annualized (E=Avg) 6.74% 7.33% 10.44% 6.40% 13.27% 9.71% 5.78% 5.74% 7.95% 7.50% 3.45% 5.93% 2.25% 1.72% 4.74% 9.16% Total Debt to Total Equity, Percent (FYO) (Z=Avg) 70.6% 34.9% 47.9% 54.1% 45.5% 62.1% 22.0% 35.0% 38.0% 30.4% 40.3% 34.6% 0.0% 28.3% 11.9% 16.0% 56.3% Beta 5 Year (Z=Avg) 0.92 1.11 1.38 0.95 1.08 1.05 0.60 1.20 1.14 1.37 0.81 0.97 0.73 0.85 0.50 1.43 1.17

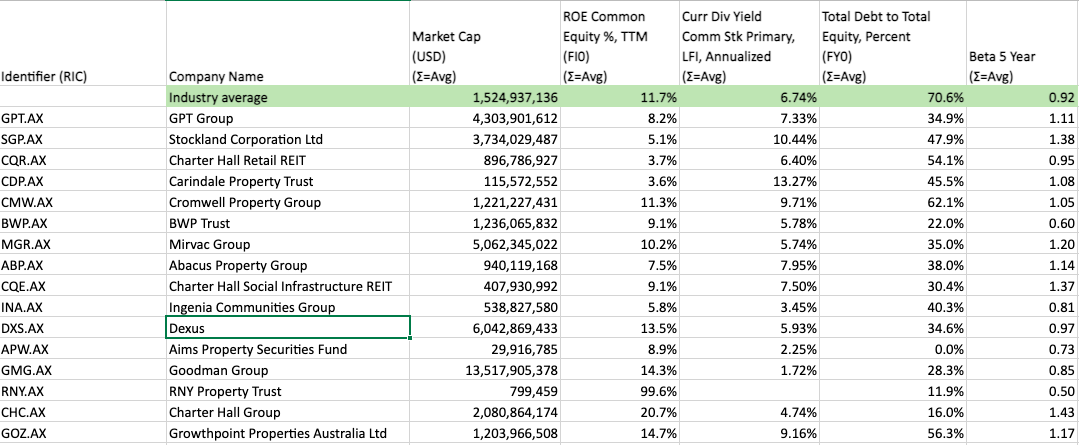
Step by Step Solution

There are 3 Steps involved in it

Step: 1

blur-text-image

Get Instant Access to Expert-Tailored Solutions

See step-by-step solutions with expert insights and AI powered tools for academic success

Step: 2

blur-text-image

Step: 3

blur-text-image

Ace Your Homework with AI

Get the answers you need in no time with our AI-driven, step-by-step assistance

Get Started

Recommended Textbook for

Enron And World Finance A Case Study In Ethics

Authors: P. Dembinski, C. Lager, A. Cornford, J. Bonvin

1st Edition

ISBN: 1403947635, 978-1403947635

More Books

Students also viewed these Finance questions

Question

1.what is the significance of Taxonomy ?

Answered: 1 week ago

Question

What are the advantages and disadvantages of leasing ?

Answered: 1 week ago

Question

Name is needed for identifying organisms ?

Answered: 1 week ago