

Answered step by step
Verified Expert Solution
Question
1 Approved Answer
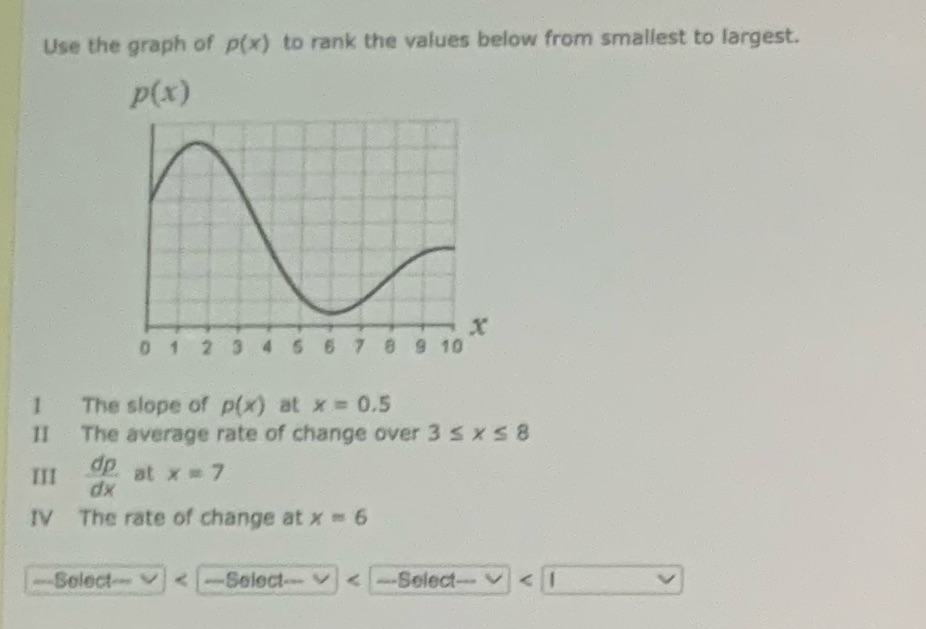
Use the graph of p(x) to rank the values below from smallest to largest. P(x) X 0 1 2 3 5 6 7 8 9
Step by Step Solution
There are 3 Steps involved in it
Step: 1

Get Instant Access to Expert-Tailored Solutions
See step-by-step solutions with expert insights and AI powered tools for academic success
Step: 2

Step: 3
Ace Your Homework with AI
Get the answers you need in no time with our AI-driven, step-by-step assistance
Get Started
Precalculus, Enhanced WebAssign Edition
Authors: James Stewart
6th Edition
1285499948, 9781285499949