Answered step by step
Verified Expert Solution
Question
1 Approved Answer
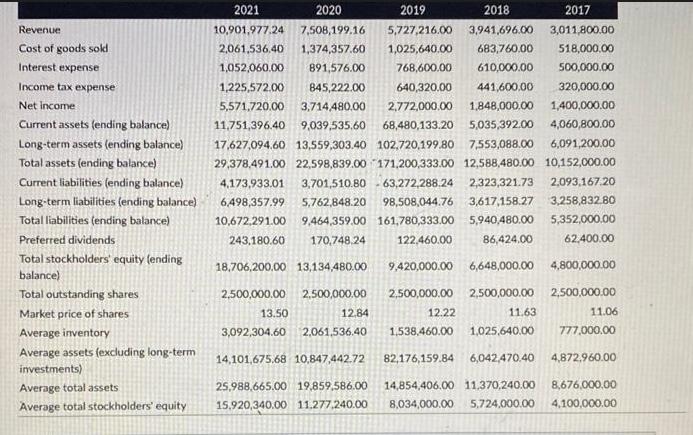
Use the information to solve the questions Revenue Cost of goods sold Interest expense Income tax expense Net income Current assets (ending balance) Long-term assets
Use the information to solve the questions


Revenue Cost of goods sold Interest expense Income tax expense Net income Current assets (ending balance) Long-term assets (ending balance) Total assets (ending balance) Current liabilities (ending balance) Long-term liabilities (ending balance) Total liabilities (ending balance) Preferred dividends Total stockholders' equity (ending balance) Total outstanding shares Market price of shares Average inventory Average assets (excluding long-term investments) Average total assets Average total stockholders' equity 2021 2020 2019 2018 640,320.00 441,600,00 320,000.00 10,901,977.24 7,508,199.16 5,727,216.00 3,941,696.00 2,061,536.40 1,374,357.60 1,025,640.00 683,760.00 1,052,060,00 891,576.00 768,600.00 610,000.00 1,225,572.00 845,222.00 5,571,720.00 3,714,480.00 2,772,000.00 1,848,000,00 1,400,000.00 11,751,396.40 9,039,535.60 68,480,133.20 5,035,392.00 4,060,800.00 17,627,094.60 13,559,303.40 102,720,199.80 7,553,088.00 6,091,200.00 29,378,491.00 22,598,839.00 171,200,333.00 12,588,480.00 10,152,000.00 4,173,933.01 3,701,510.80-63,272,288.24 2,323,321.73 2,093,167.20 6,498,357.99 5,762,848.20 98,508,044.76 3,617,158.27 3,258,832.80 10,672,291.00 9,464,359.00 161,780,333.00 5,940,480.00 5,352,000.00 243,180.60 170,748,24 122,460.00 86,424,00 62,400.00 9,420,000.00 6,648,000.00 4,800,000.00 2,500,000.00 2,500,000.00 18,706,200.00 13,134,480.00 2,500,000.00 2,500,000.00 13.50 12,84 3,092,304.60 2,061,536.40 14,101,675.68 10,847,442.72 25,988,665.00 19,859,586.00 15.920,340.00 11.277.240.00 12.22 11.63 1,538,460.00 1,025,640.00 2017 3,011,800.00 518,000.00 500,000.00 2,500,000.00 11.06 777,000.00 82,176,159.84 6,042,470.40 14,854,406.00 11,370,240.00 8,676,000.00 8,034,000.00 5,724,000.00 4,100,000.00 4,872,960.00
Step by Step Solution
★★★★★
3.53 Rating (150 Votes )
There are 3 Steps involved in it
Step: 1
To calculate Asset Turnover for 2019 using the corrected amount we need to first calculate the corrected Average Assets excluding longterm investments ...
Get Instant Access to Expert-Tailored Solutions
See step-by-step solutions with expert insights and AI powered tools for academic success
Step: 2

Step: 3

Ace Your Homework with AI
Get the answers you need in no time with our AI-driven, step-by-step assistance
Get Started


