

Question
Use the model developed in Example 1.5 to predict the total sales for weeks 2 through 16, and compare the results to the observed sales.
Use the model developed in Example 1.5 to predict the total sales for weeks 2 through 16, and compare the results to the observed sales. Does the accuracy of the model seem to be different when coupons are used or not? When advertising is used or not?
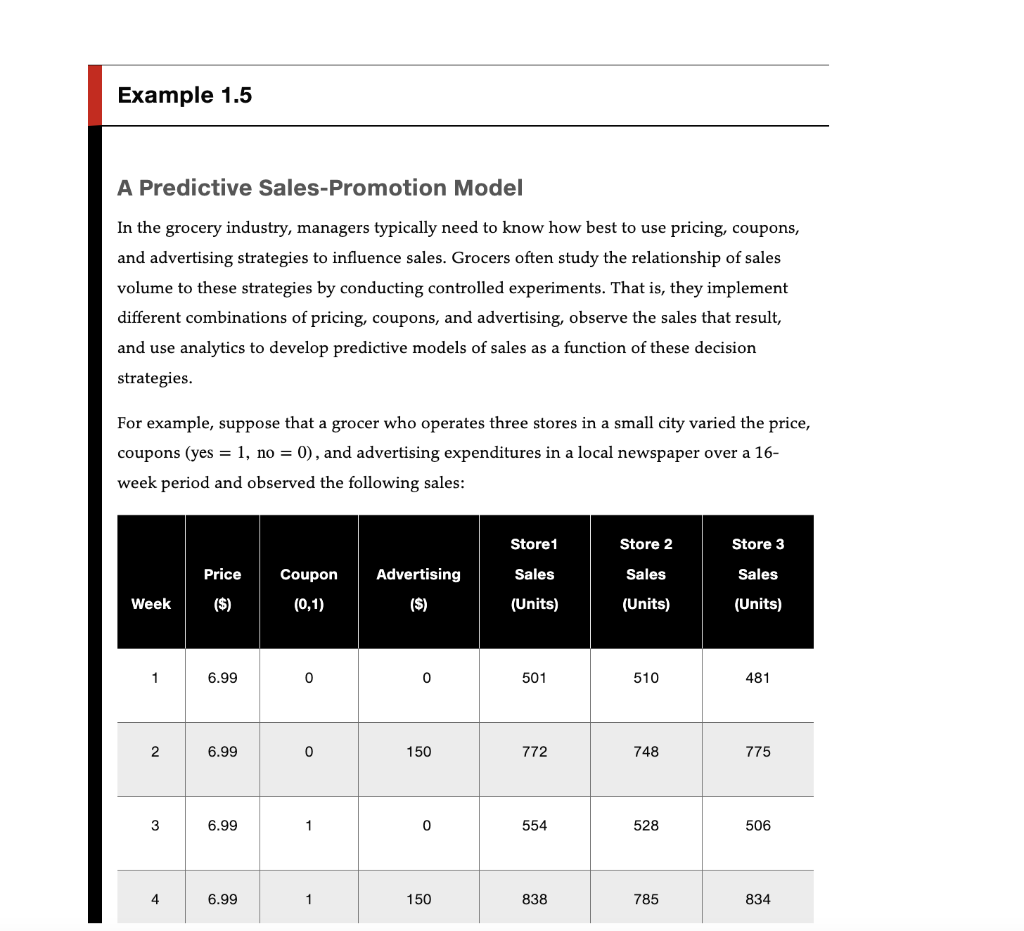
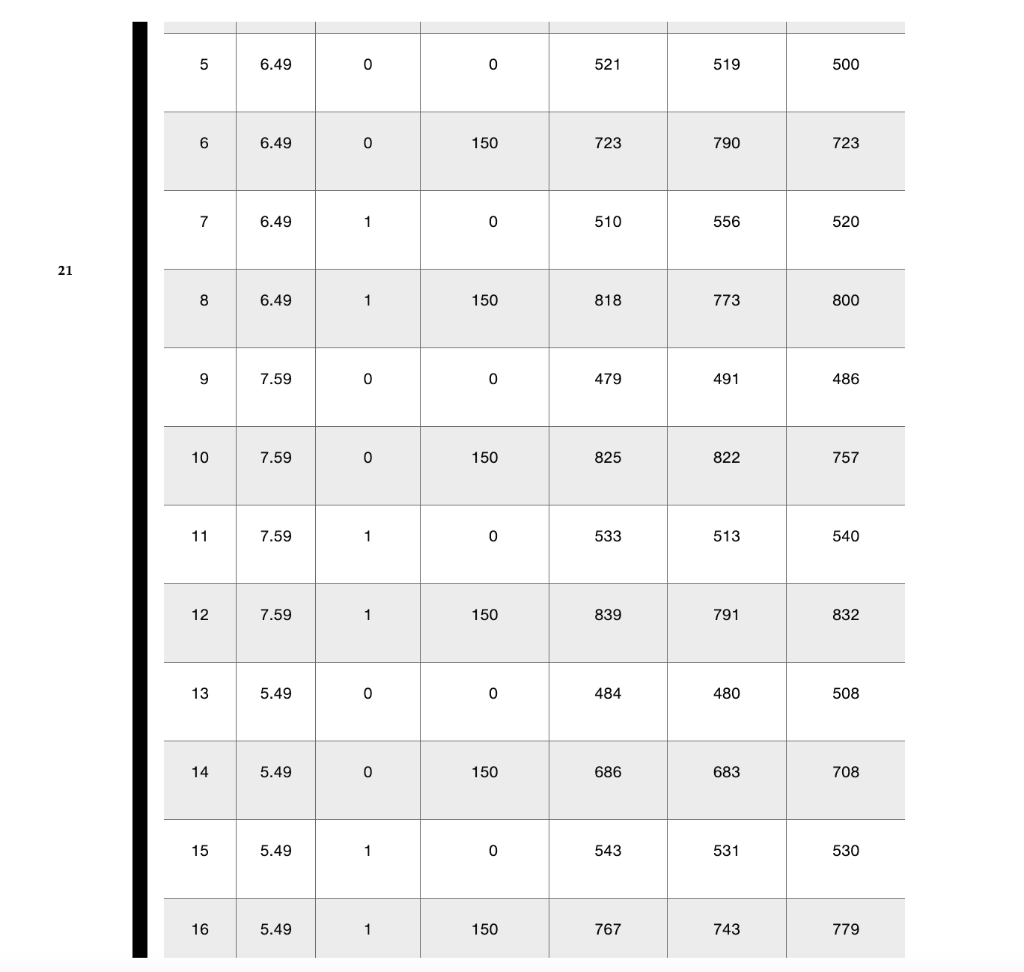
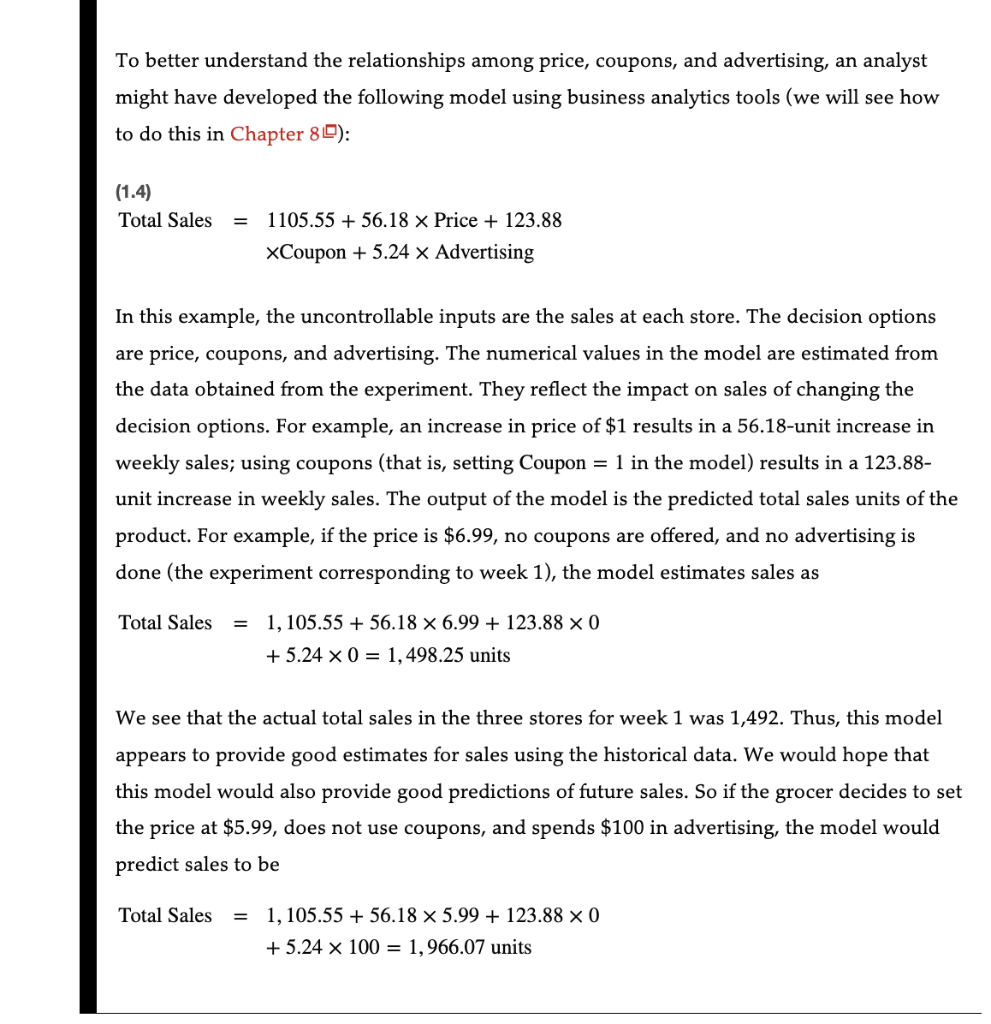
A Predictive Sales-Promotion Model In the grocery industry, managers typically need to know how best to use pricing, coupons, and advertising strategies to influence sales. Grocers often study the relationship of sales volume to these strategies by conducting controlled experiments. That is, they implement different combinations of pricing, coupons, and advertising, observe the sales that result, and use analytics to develop predictive models of sales as a function of these decision strategies. For example, suppose that a grocer who operates three stores in a small city varied the price, coupons (yes =1, no =0 ) , and advertising expenditures in a local newspaper over a 16week period and observed the following sales: To better understand the relationships among price, coupons, and advertising, an analyst might have developed the following model using business analytics tools (we will see how to do this in Chapter 8 ): (1.4) Total Sales =1105.55+56.18 Price +123.88 Coupon +5.24 Advertising In this example, the uncontrollable inputs are the sales at each store. The decision options are price, coupons, and advertising. The numerical values in the model are estimated from the data obtained from the experiment. They reflect the impact on sales of changing the decision options. For example, an increase in price of $1 results in a 56.18-unit increase in weekly sales; using coupons (that is, setting Coupon =1 in the model) results in a 123.88unit increase in weekly sales. The output of the model is the predicted total sales units of the product. For example, if the price is $6.99, no coupons are offered, and no advertising is done (the experiment corresponding to week 1 ), the model estimates sales as Total Sales =1,105.55+56.186.99+123.880 +5.240=1,498.25 units We see that the actual total sales in the three stores for week 1 was 1,492. Thus, this model appears to provide good estimates for sales using the historical data. We would hope that this model would also provide good predictions of future sales. So if the grocer decides to set the price at $5.99, does not use coupons, and spends $100 in advertising, the model would predict sales to be TotalSales=1,105.55+56.185.99+123.880+5.24100=1,966.07unitsStep by Step Solution
There are 3 Steps involved in it
Step: 1

Get Instant Access to Expert-Tailored Solutions
See step-by-step solutions with expert insights and AI powered tools for academic success
Step: 2

Step: 3
Ace Your Homework with AI
Get the answers you need in no time with our AI-driven, step-by-step assistance
Get Started
Principles of Accounting
Authors: Needles, Powers, crosson
11th Edition
1439037744, 978-1133626985, 978-1439037744