

Answered step by step
Verified Expert Solution
Question
1 Approved Answer
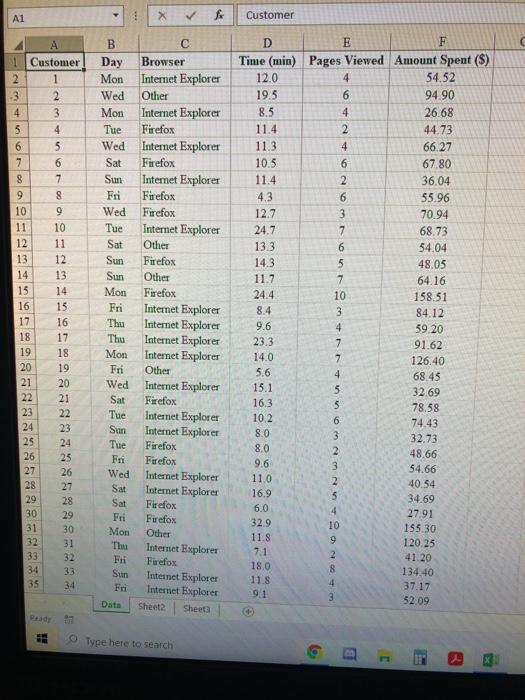
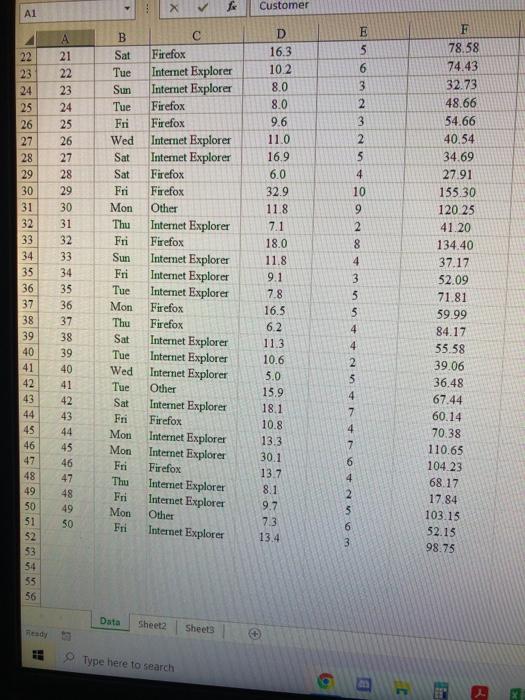
Use the Shoppers.xlsx file for these questions Download the responses into Excel. Save the file to the Desktop. Name the file YourName_GBS221_Descriptive_TestPt1 Label the tab
Use the Shoppers.xlsx file for these questions
Download the responses into Excel. Save the file to the Desktop. Name the file YourName_GBS221_Descriptive_TestPt1
Label the tab containing the original data Data . Copy and paste the data column needed for each question in a separate Excel Tab, then solve the problem. Label the tab with the problem number. #1, #2, #3, etc. Clearly type a label to identify each answer in the worksheet. You can highlight the answers in yellow to make them easy to find.
Calculate the statistics using either Excel or your calculator. Use Excel to create the charts. Make sure each chart has a title. Use the chart elements you feel are most appropriate.
Round all answers to one decimal position higher than the original data value.
5 pts For the Time variable calculate: the mean , median, mode, variance and the standard deviation. Round the numbers to two decimal places.
5 pts Using either a pivot table or the CountIf function create a frequency distribution, with percentages, for the Browser variable. Create a Column chart showing the proportion of each Browser usage of the respondents. Be sure to title the chart. Show the percentage values to one decimal place.
5 pts Using the Day variable Using either a pivot table or the CountIf function, create a frequency distribution showing the frequencies and percentages for each day of the week. Create a 2-D pie chart of the results. Show the percentage values to one decimal place.
5 pts Sort the data for the Amount Spent amount in ascending order. Using the Excel built-in functions, Calculate Q1, Q2, Q3. Calculate the Interquartile Range, the Lower limit and the Upper limit for the Amount Spent variable. Type the answers in the excel tab containing the data. Show the answers to two decimal places.
5 pts For Amount Spent variable, can any of the Amount Spent values be considered outliers; Using the definition of an outlier being any value with a Z-score greater than or equal to 3.0 or a Z-score less than or equal to -3 ? How many outliers are there in the data? If so, list the outliers. Show the answers to two decimal places. If there are no outliers, just type "NO OUTLIERS"
5 pts. Create a frequency distribution of the Amount Spent variable. Create classes to group the data starting at $0 and ending at $160 by 20. Use a class size of 20. Create a histogram of this data. Include a title, Amount Spent on the histogram. What is the frequency of the $40 -60 class?
2.5 pt : Calculate the Average Time for the three Browsers. Show the answer to one decimal place.
2.5 pt: Calculate the Standard Deviation of the Time for the three Browsers. Show the answer to one decimal place
5 pt: Calculate the Coefficient of Variation of the Time for the three Browsers. Give the answer to one decimal place.
5 pts: Which Browsers has the most variation in the Time spent online.
5 pts: Use the PanamaRailroad.xlsx file to calculate the Geometric mean of the return for the Panama Railroad Company Stock. Show Geometric mean of the growth factors to four decimal places.
5 pts: Create a cross-tabulation showing Browsers as the Row labels and Day as the column labels. The Values should be the Sum of the Amount Spent. What percentage of the total Amount Spent is spent by FireFox Users on Friday? Give the answer to one decimal place?
5 pts: Construct a scatter diagram with Page Views as the X- variable and Amount Spent as the Y-variable. Add the Trendline, Equation, and the R-Squared value. What percentage of the variation of the Y-variable can be accounted by the equation? Give your answer to one decimal place.
Step by Step Solution
There are 3 Steps involved in it
Step: 1

Get Instant Access to Expert-Tailored Solutions
See step-by-step solutions with expert insights and AI powered tools for academic success
Step: 2

Step: 3
Ace Your Homework with AI
Get the answers you need in no time with our AI-driven, step-by-step assistance
Get Started
The Accidental Data Scientist
Authors: Amy Affelt
1st Edition
1573877077, 9781573877077