Question
Use the Variance Covariance matrix in the Excel file: Efficient Portfolios Data. Construct a model with excel to determine the following: a. Calculate an envelope
Use the Variance Covariance matrix in the Excel file: Efficient Portfolios Data. Construct a model with excel to determine the following:
a. Calculate an envelope portfolio assuming the risk-free rate is 3%.
b. Calculate an envelope portfolio assuming the risk-free rate is 12%.
c. Create a one-way data table that determines the different means and standard deviations for combinations of Envelope Portfolio 1 and Envelope Portfolio 2 by varying the proportion of Portfolio 1 from -5 to +5 in increments of 0.50.
d. Graph the combinations of the portfolios from the one-way data table and add the individual asset means and standard deviations to the graph.
e. Provide a title on the graph and label the axes of the graph. f. Could the portfolio combinations be on the efficient frontier? Why or why not?
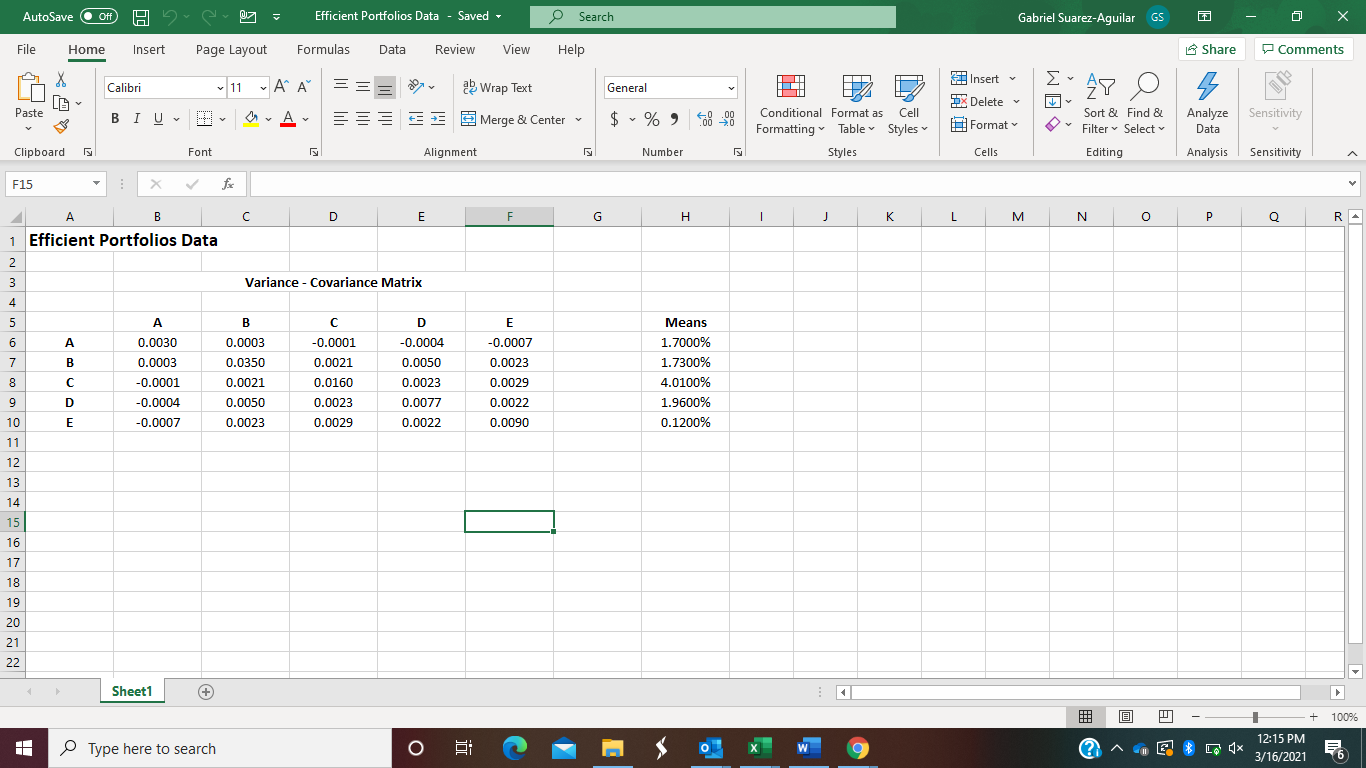
AutoSave Off HD Efficient Portfolios Data - Saved Search Gabriel Suarez-Aguilar GS File Home Insert Page Layout Formulas Data Review View Help Share Comments Insert Calibri == General AY O s 11 A A a-A- a Wrap Text E- Merge & Center DX Delete Paste BIU Analyze y $ % -29 Sensitivity y Format Conditional Format as Cell Formatting Table Styles Styles Sort & Find & Filter Select v Editing Data Clipboard Font Alignment Number Cells Analysis Sensitivity F15 X C D E F G H 1 K L M N O P Q RA A B 1 Efficient Portfolios Data 2 3 Variance - Covariance Matrix 4 5 B E 0.0030 6 A 7 B -0.0001 0.0021 0.0160 0.0023 0.0029 0.0003 -0.0001 -0.0004 -0.0007 D -0.0004 0.0050 0.0023 0.0077 0.0022 0.0003 0.0350 0.0021 0.0050 0.0023 8 9 9 Means 1.7000% 1.7300% 4.0100% 1.9600% 0.1200% -0.0007 0.0023 0.0029 0.0022 0.0090 D 10 E 11 12 13 14 15 16 17 18 19 20 21 22 Sheet1 + + 100% Type here to search o > 2 E o 12:15 PM 3/16/2021 6 AutoSave Off HD Efficient Portfolios Data - Saved Search Gabriel Suarez-Aguilar GS File Home Insert Page Layout Formulas Data Review View Help Share Comments Insert Calibri == General AY O s 11 A A a-A- a Wrap Text E- Merge & Center DX Delete Paste BIU Analyze y $ % -29 Sensitivity y Format Conditional Format as Cell Formatting Table Styles Styles Sort & Find & Filter Select v Editing Data Clipboard Font Alignment Number Cells Analysis Sensitivity F15 X C D E F G H 1 K L M N O P Q RA A B 1 Efficient Portfolios Data 2 3 Variance - Covariance Matrix 4 5 B E 0.0030 6 A 7 B -0.0001 0.0021 0.0160 0.0023 0.0029 0.0003 -0.0001 -0.0004 -0.0007 D -0.0004 0.0050 0.0023 0.0077 0.0022 0.0003 0.0350 0.0021 0.0050 0.0023 8 9 9 Means 1.7000% 1.7300% 4.0100% 1.9600% 0.1200% -0.0007 0.0023 0.0029 0.0022 0.0090 D 10 E 11 12 13 14 15 16 17 18 19 20 21 22 Sheet1 + + 100% Type here to search o > 2 E o 12:15 PM 3/16/2021 6Step by Step Solution
There are 3 Steps involved in it
Step: 1
Get Instant Access to Expert-Tailored Solutions
See step-by-step solutions with expert insights and AI powered tools for academic success
Step: 2
Step: 3
Ace Your Homework with AI
Get the answers you need in no time with our AI-driven, step-by-step assistance
Get Started