

Answered step by step
Verified Expert Solution
Question
1 Approved Answer
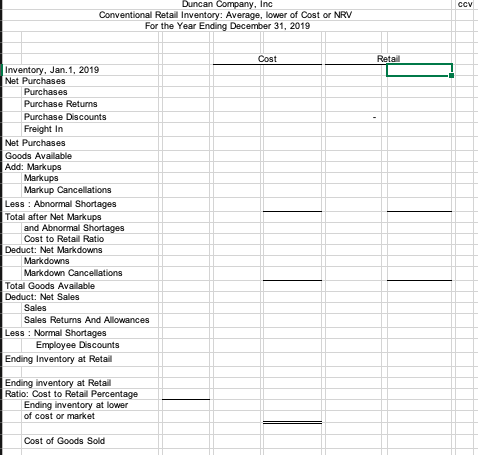
Use this data information to fill out this empty Retail inventory chart The following information was taken from Duncan Company, Inc Cost 250,000 914,500 (60,000)
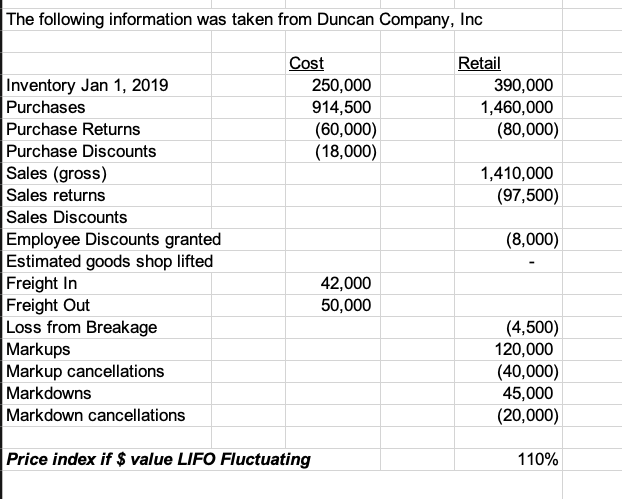
Use this data information to fill out this empty Retail inventory chart
Step by Step Solution
There are 3 Steps involved in it
Step: 1

Get Instant Access to Expert-Tailored Solutions
See step-by-step solutions with expert insights and AI powered tools for academic success
Step: 2

Step: 3
Ace Your Homework with AI
Get the answers you need in no time with our AI-driven, step-by-step assistance
Get Started
Social Media Marketing 2020
Authors: Frank Darrell
1st Edition
1706900988, 978-1706900986