Answered step by step
Verified Expert Solution
Question
1 Approved Answer
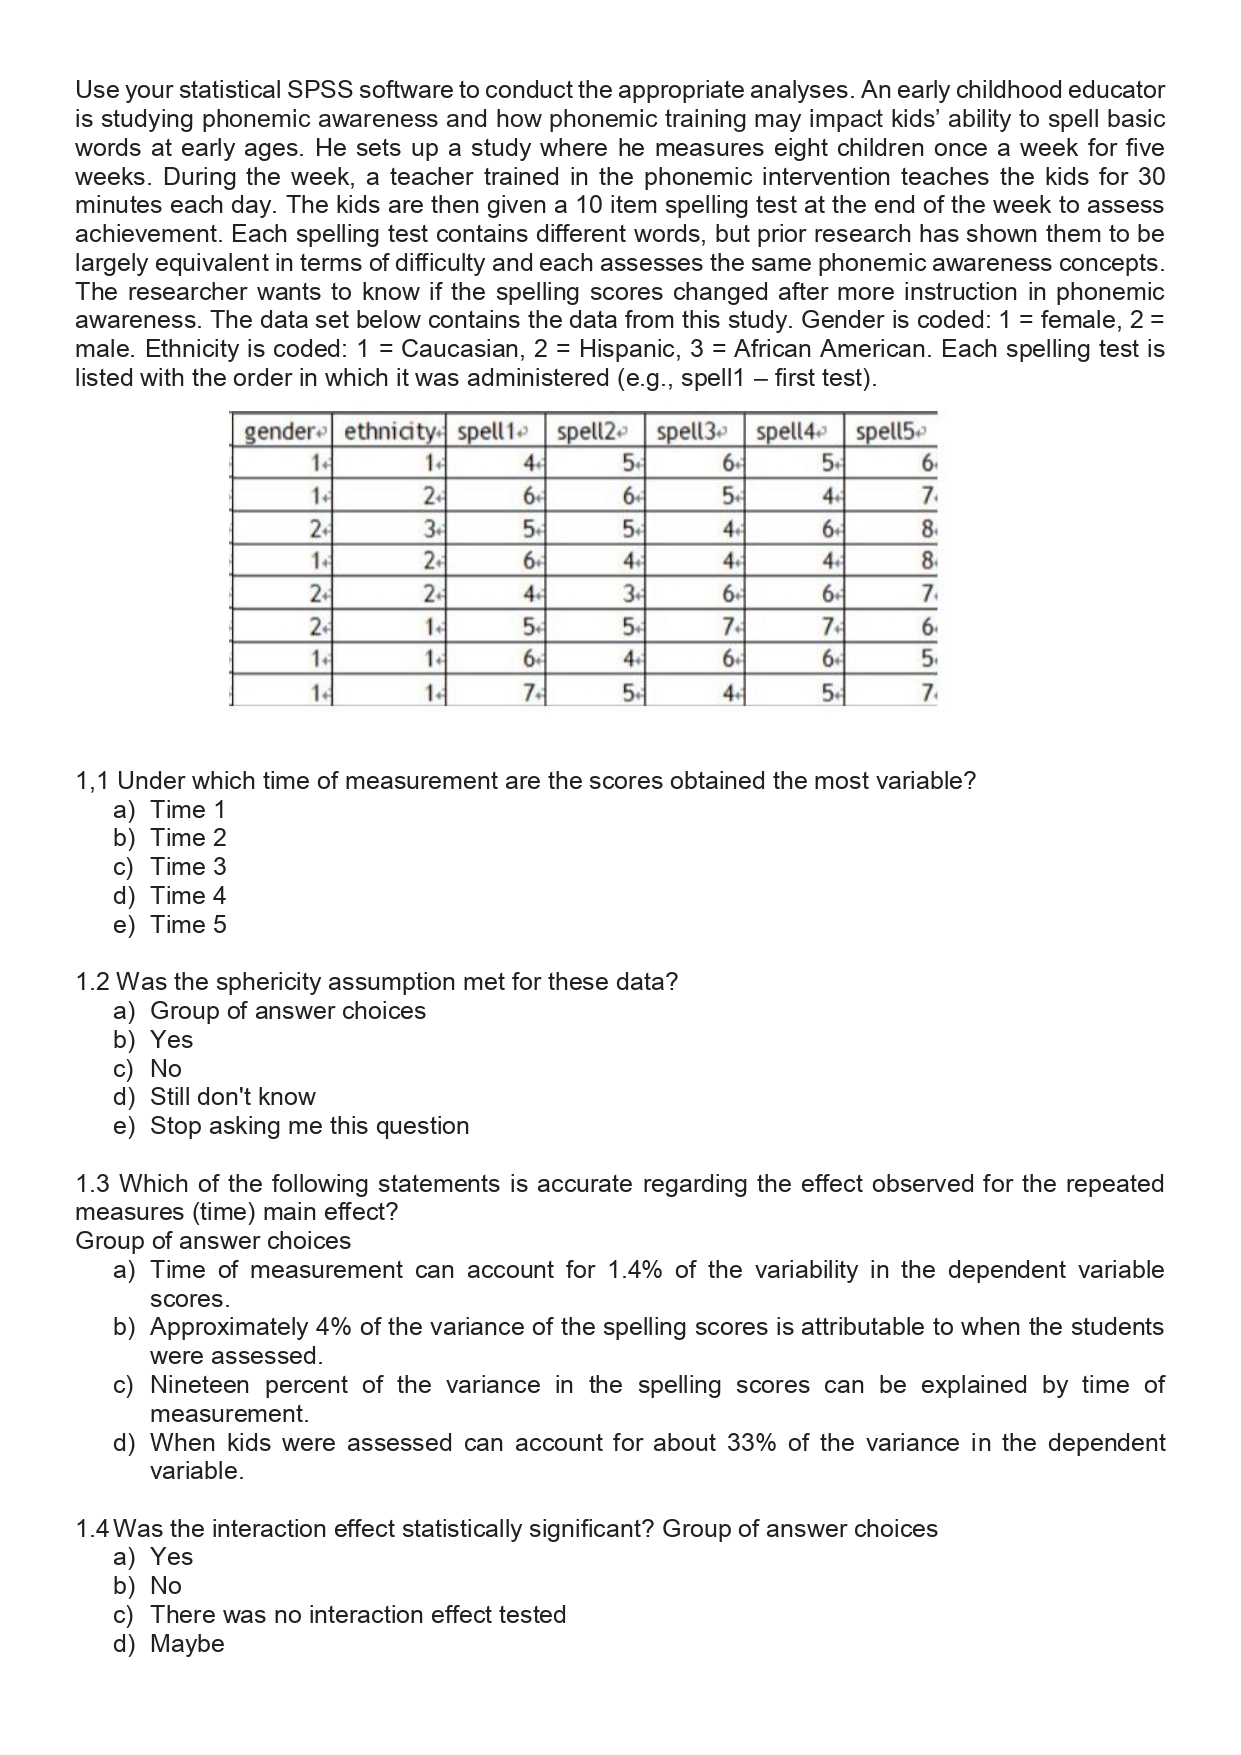
Use your statistical SPSS software to conduct the appropriate analyses. An early childhood educator is studying phonemic awareness and how phonemic training may impact kids'

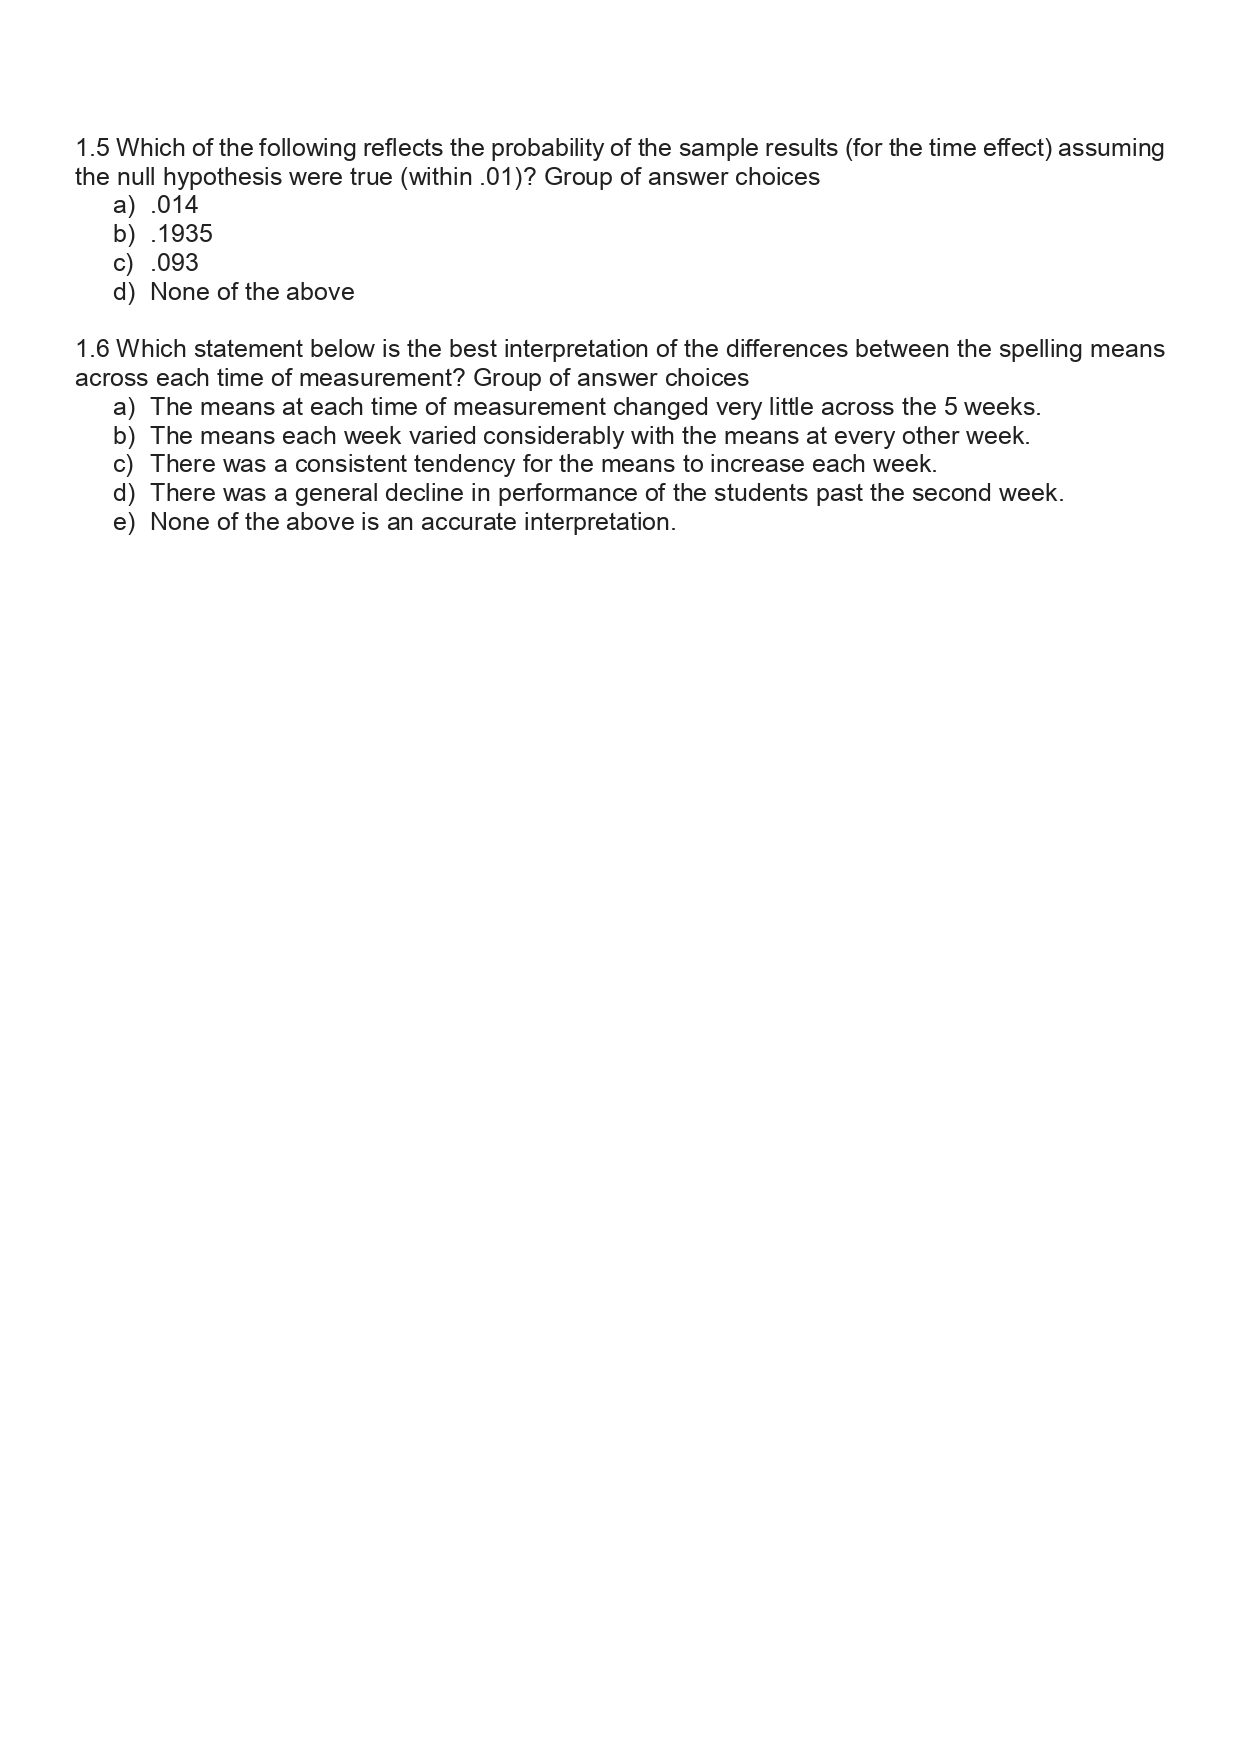
 Use your statistical SPSS software to conduct the appropriate analyses. An early childhood educator is studying phonemic awareness and how phonemic training may impact kids' ability to spell basic words at early ages. He sets up a study where he measures eight children once a week for five weeks. During the week, a teacher trained in the phonemic intervention teaches the kids for 30 minutes each day. The kids are then given a 10 item spelling test at the end of the week to assess achievement. Each spelling test contains different words, but prior research has shown them to be largely equivalent in terms of difficulty and each assesses the same phonemic awareness concepts. The researcher wants to know if the spelling scores changed after more instruction in phonemic awareness. The data set below contains the data from this study. Gender is coded: 1= female, 2= male. Ethnicity is coded: 1 = Caucasian, 2 = Hispanic, 3 = African American. Each spelling test is listed with the order in which it was administered (e.g., spell1 - first test). 1,1 Under which time of measurement are the scores obtained the most variable? a) Time 1 b) Time 2 c) Time 3 d) Time 4 e) Time 5 1.2 Was the sphericity assumption met for these data? a) Group of answer choices b) Yes c) No d) Still don't know e) Stop asking me this question 1.3 Which of the following statements is accurate regarding the effect observed for the repeated measures (time) main effect? Group of answer choices a) Time of measurement can account for 1.4% of the variability in the dependent variable scores. b) Approximately 4% of the variance of the spelling scores is attributable to when the students were assessed. c) Nineteen percent of the variance in the spelling scores can be explained by time of measurement. d) When kids were assessed can account for about 33% of the variance in the dependent variable. 1.4 Was the interaction effect statistically significant? Group of answer choices a) Yes b) No c) There was no interaction effect tested d) Maybe 1.5 Which of the following reflects the probability of the sample results (for the time effect) assuming the null hypothesis were true (within .01)? Group of answer choices a) .014 b) .1935 c) .093 d) None of the above 1.6 Which statement below is the best interpretation of the differences between the spelling means across each time of measurement? Group of answer choices a) The means at each time of measurement changed very little across the 5 weeks. b) The means each week varied considerably with the means at every other week. c) There was a consistent tendency for the means to increase each week. d) There was a general decline in performance of the students past the second week. e) None of the above is an accurate interpretation
 Step by Step Solution
There are 3 Steps involved in it
Step: 1

Get Instant Access to Expert-Tailored Solutions
See step-by-step solutions with expert insights and AI powered tools for academic success
Step: 2

Step: 3

Ace Your Homework with AI
Get the answers you need in no time with our AI-driven, step-by-step assistance
Get Started


