Answered step by step
Verified Expert Solution
Question
1 Approved Answer
Using an Excel spreadsheet* and your company's financial statements, compute the following for the most recent two years Current ratio Working capital Inventory turnover ratio
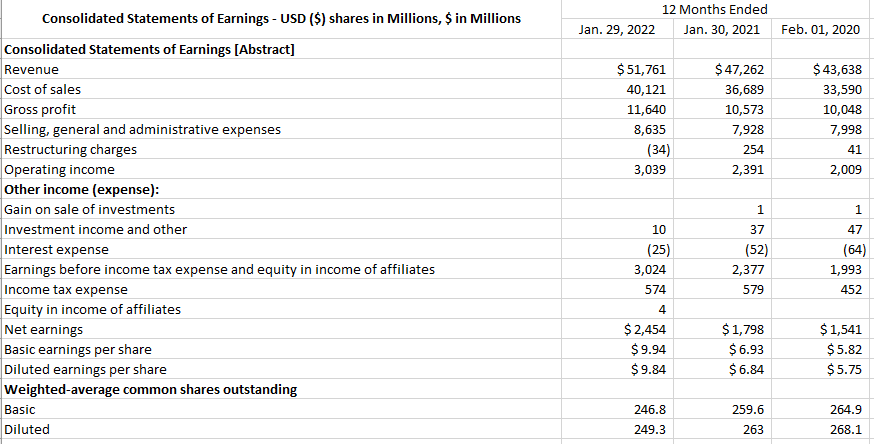
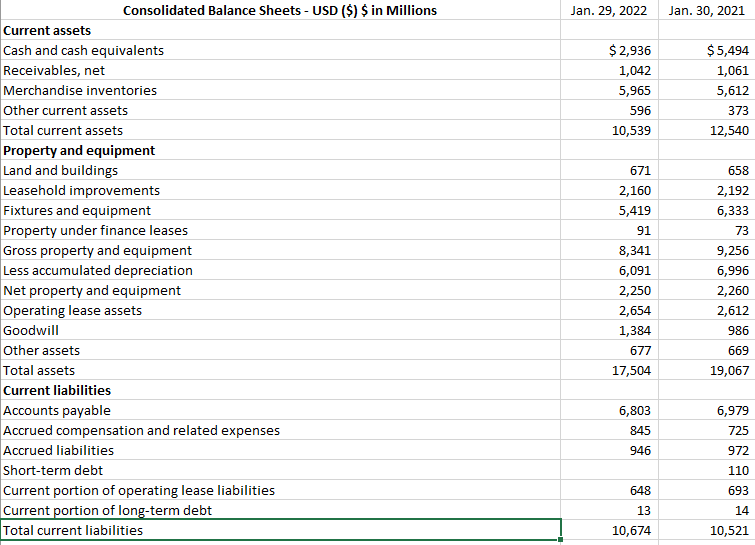

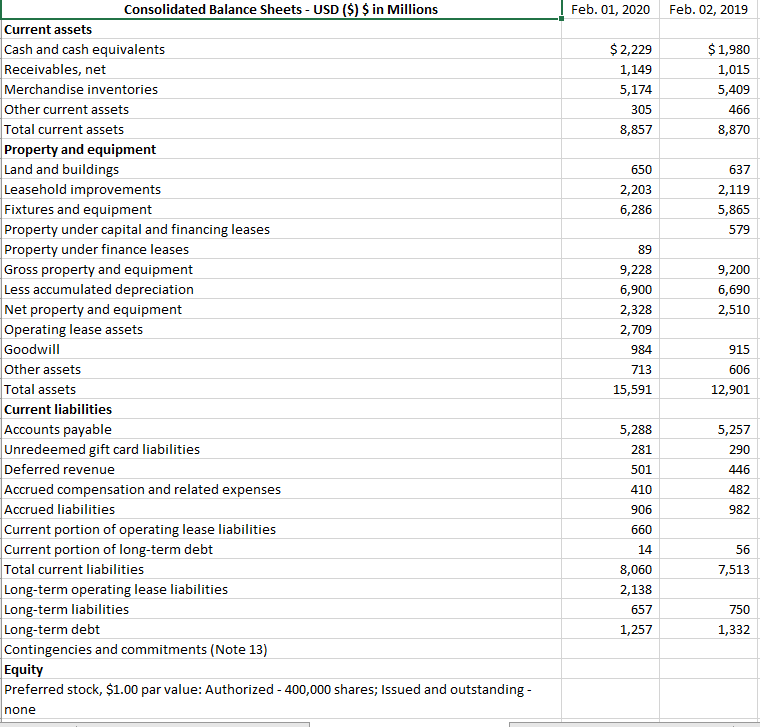

Using an Excel spreadsheet* and your company's financial statements, compute the following for the most recent two years
Current ratio
Working capital
Inventory turnover ratio
Accounts Receivable turnover ratio
Debt to total assets ratio
Return on assets
Asset turnover ratio
Return on equity
Gross profit ratio
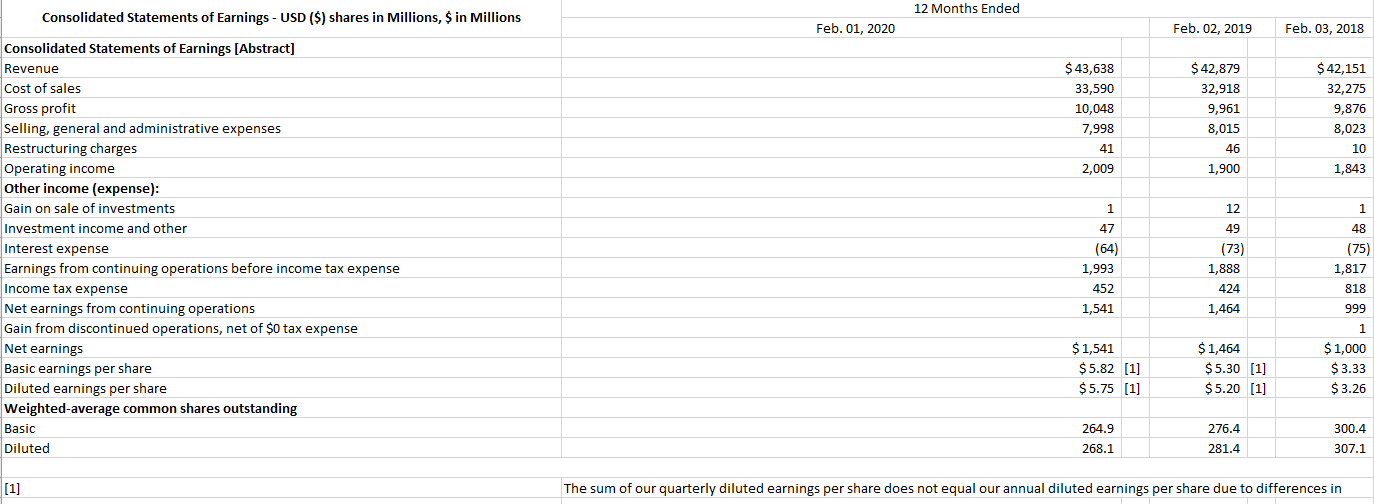
Profit margin ratio
If possible please show the math so I can learn.
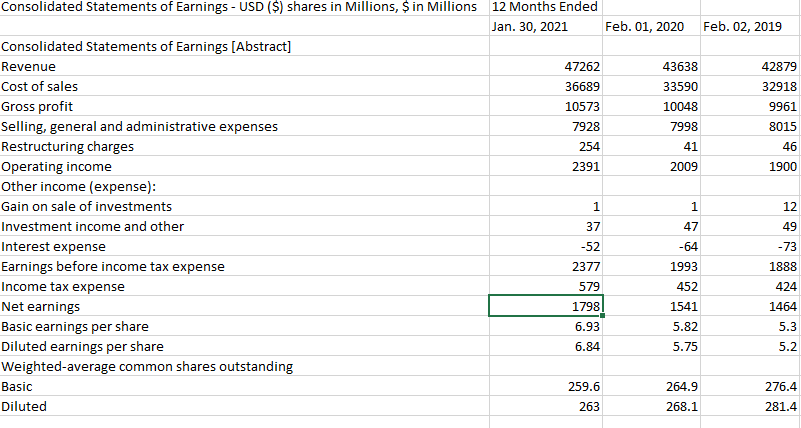
38 Total equity 39 Total liabilities and equity \begin{tabular}{|r|r} 3,020 & 4,587 \\ \hline 17,504 & 19,067 \\ \hline \end{tabular} Consolidated Statements of Earnings - USD (\$) shares in Millions, \$ in Millions 12 Months Ended Jan.30,2021Feb.01,2020Feb.02,2019 Consolidated Statements of Earnings [Abstract] Revenue Cost of sales Gross profit Selling, general and administrative expenses Restructuring charges Operating income Other income (expense): Gain on sale of investments Investment income and other Interest expense Earnings before income tax expense Income tax expense Net earnings Basic earnings per share Diluted earnings per share \begin{tabular}{|r|r|r|r|} \hline 47262 & 43638 & 42879 \\ \hline 36689 & 33590 & 32918 \\ \hline 10573 & 10048 & 9961 \\ \hline 7928 & 7998 & 8015 \\ \hline 254 & 41 & 46 \\ \hline 2391 & 2009 & 1900 \\ \hline \end{tabular} Weighted-average common shares outstanding Basic Diluted \begin{tabular}{|r|r|r|} \hline 1 & 1 & 12 \\ \hline 37 & 47 & 49 \\ \hline52 & 64 & 73 \\ \hline 2377 & 1993 & 1888 \\ \hline 579 & 452 & 424 \\ \hline 1798 & 1541 & 1464 \\ \hline 6.93 & 5.82 & 5.3 \\ \hline 6.84 & 5.75 & 5.2 \\ \hline & & \\ \hline 259.6 & 264.9 & 276.4 \\ \hline 263 & 268.1 & 281.4 \\ \hline \end{tabular} Total equity Total liabilities and equity \begin{tabular}{r|r} 3,479 & 3,306 \\ \hline$15,591 & $12,901 \\ \hline \end{tabular} [1] The sum of our quarterly diluted earnings per share does not equal our annual diluted earnings per share due to differences inStep by Step Solution
There are 3 Steps involved in it
Step: 1

Get Instant Access to Expert-Tailored Solutions
See step-by-step solutions with expert insights and AI powered tools for academic success
Step: 2

Step: 3
Ace Your Homework with AI
Get the answers you need in no time with our AI-driven, step-by-step assistance
Get Started