Answered step by step
Verified Expert Solution
Question
1 Approved Answer
Using annual data since 1956 , create scatter plots of the following variables: a. CPI inflation rate (December to December) against the average unemployment rate
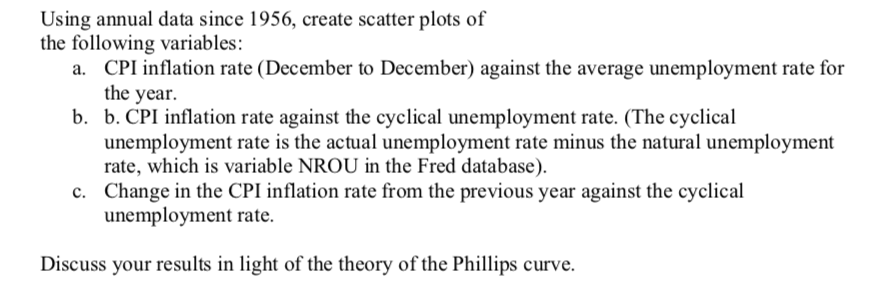
Using annual data since 1956 , create scatter plots of the following variables: a. CPI inflation rate (December to December) against the average unemployment rate for the year. b. b. CPI inflation rate against the cyclical unemployment rate. (The cyclical unemployment rate is the actual unemployment rate minus the natural unemployment rate, which is variable NROU in the Fred database). c. Change in the CPI inflation rate from the previous year against the cyclical unemployment rate. Discuss your results in light of the theory of the Phillips curve. Using annual data since 1956 , create scatter plots of the following variables: a. CPI inflation rate (December to December) against the average unemployment rate for the year. b. b. CPI inflation rate against the cyclical unemployment rate. (The cyclical unemployment rate is the actual unemployment rate minus the natural unemployment rate, which is variable NROU in the Fred database). c. Change in the CPI inflation rate from the previous year against the cyclical unemployment rate. Discuss your results in light of the theory of the Phillips curve
Step by Step Solution
There are 3 Steps involved in it
Step: 1
Get Instant Access to Expert-Tailored Solutions
See step-by-step solutions with expert insights and AI powered tools for academic success
Step: 2
Step: 3
Ace Your Homework with AI
Get the answers you need in no time with our AI-driven, step-by-step assistance
Get Started