

Answered step by step
Verified Expert Solution
Question
1 Approved Answer
Using data from 1920 and projected to 2030, the percent P of men 65 years of age or older in the labor force can
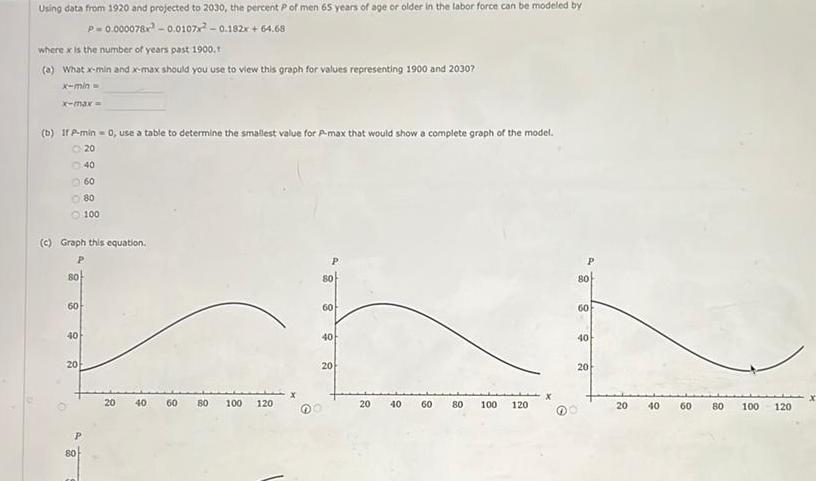
Using data from 1920 and projected to 2030, the percent P of men 65 years of age or older in the labor force can be modeled by P=0.000078x-0.0107x -0.182x + 64.68 where x is the number of years past 1900.t (a) What x-min and x-max should you use to view this graph for values representing 1900 and 20307 x-min- x-max= (b) If P-min = 0, use a table to determine the smallest value for P-max that would show a complete graph of the model. 020 40 60 80 100 (c) Graph this equation. P 80 60 40 20 80 20 gg O 8 100 120 80 60 40 20 20 20 00 40 60 60 80 100 120 80 60 40 20 20 x 20 40 60 80 100 120
Step by Step Solution
There are 3 Steps involved in it
Step: 1

Get Instant Access to Expert-Tailored Solutions
See step-by-step solutions with expert insights and AI powered tools for academic success
Step: 2

Step: 3
Ace Your Homework with AI
Get the answers you need in no time with our AI-driven, step-by-step assistance
Get Started
Functional Differential Geometry
Authors: Gerald Jay Sussman, Jack Wisdom, Will Farr
1st Edition
0262315610, 9780262315616