

Question
Using data from both companies , compare their performance. In your analysis, explain which company you would prefer doing business from the perspective of the
Using data from both companies, compare their performance. In your analysis, explain which company you would prefer doing business from the perspective of the following parties:
a) A longterm lender
b) An investor.
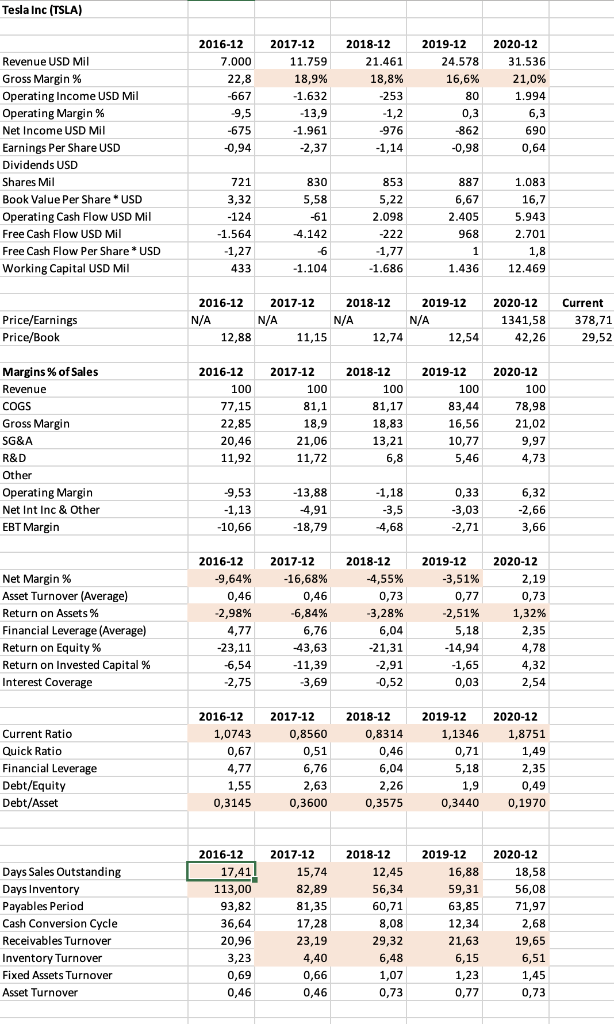
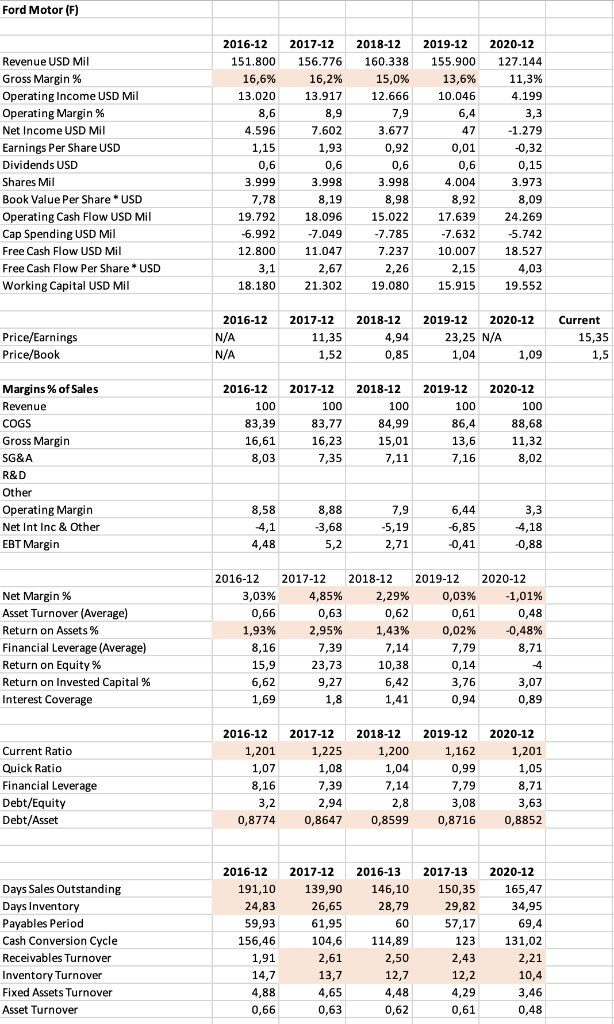
Tesla Inc (TSLA) 2016-12 7.000 22,8 -667 -9,5 -675 -0,94 2017-12 11.759 18,9% -1.632 -13,9 -1.961 -2,37 2018-12 21.461 18,8% -253 -1,2 -976 -1,14 2019-12 24.578 16,6% 80 0,3 -862 -0,98 2020-12 31.536 21,0% 1.994 6,3 690 0,64 Revenue USD Mil Gross Margin % Operating Income USD Mil Operating Margin % Net Income USD Mil Earnings Per Share USD Dividends USD Shares Mil Book Value Per Share * USD Operating Cash Flow USD Mil Free Cash Flow USD Mil Free Cash Flow Per Share * USD Working Capital USD Mil 721 3,32 -124 -1.564 -1,27 433 830 5,58 -61 4.142 6 -1.104 853 5,22 2.098 -222 -1,77 -1.686 887 6,67 2.405 968 1 1.436 1.083 16,7 5.943 2.701 1,8 12.469 2016-12 2017-12 2018-12 N/A N/A N/A 12,88 11,15 Price/Earnings Price/Book 2019-12 N/A 12,54 2020-12 1341,58 42,26 Current 378,71 12,74 29,52 Margins % of Sales Revenue COGS Gross Margin SG&A R&D Other Operating Margin Net Int Inc & Other EBT Margin 2016-12 100 77,15 22,85 20,46 11,92 2017-12 100 81,1 18,9 21,06 11,72 2018-12 100 81,17 18,83 13,21 6,8 2019-12 100 83,44 16,56 10,77 5,46 2020-12 100 78,98 21,02 9,97 4,73 -9,53 -1,13 -10,66 -13,88 4,91 -18,79 -1,18 -3,5 -4,68 0,33 -3,03 -2,71 6,32 -2,66 3,66 Net Margin% Asset Turnover (Average) Return on Assets % Financial Leverage (Average) Return on Equity % Return on invested Capital % Interest Coverage 2016-12 -9,64% 0,46 -2,98% 4,77 -23,11 -6,54 -2,75 2017-12 -16,68% 0,46 -6,84% 6,76 43,63 -11,39 -3,69 2018-12 -4,55% 0,73 -3,28% 6,04 -21,31 -2,91 -0,52 2019-12 -3,51% 0,77 -2,51% 5,18 -14,94 -1,65 0,03 2020-12 2,19 0,73 1,32% 2,35 4,78 4,32 2,54 Current Ratio Quick Ratio Financial Leverage Debt/Equity Debt/Asset 2016-12 1,0743 0,67 4,77 1,55 0,3145 2017-12 0,8560 0,51 6,76 2,63 0,3600 2018-12 0,8314 0,46 6,04 2,26 0,3575 2019-12 1,1346 0,71 5,18 1,9 0,3440 2020-12 1,8751 1,49 2,35 0,49 0,1970 Days Sales Outstanding Days Inventory Payables Period Cash Conversion Cycle Receivables Turnover Inventory Turnover Fixed Assets Turnover Asset Turnover 2016-12 17,41 113,00 93,82 36,64 20,96 3,23 0,69 0,46 2017-12 15,74 82,89 81,35 17,28 23,19 4,40 0,66 0,46 2018-12 12,45 56,34 60,71 8,08 29,32 6,48 1,07 0,73 2019-12 16,88 59,31 63,85 12,34 21,63 6,15 1,23 0,77 2020-12 18,58 56,08 71,97 2,68 19,65 6,51 1,45 0,73 Ford Motor (F) Revenue USD Mil Gross Margin % Operating Income USD Mil Operating Margin % Net Income USD Mil Earnings Per Share USD Dividends USD Shares Mil Book Value Per Share USD Operating Cash Flow USD Mil Cap Spending USD Mil Free Cash Flow USD Mil Free Cash Flow Per Share USD Working Capital USD Mil 2016-12 151.800 16,6% 13.020 8,6 4.596 1,15 0,6 3.999 7,78 19.792 6.992 12.800 3,1 18.180 2017-12 156.776 16,2% 13.917 8,9 7.602 1,93 0,6 3.998 8,19 18.096 -7.049 11.047 2,67 21.302 2018-12 160.338 15,0% 12.666 7,9 3.677 0,92 0,6 3.998 8,98 15.022 -7.785 7.237 2,26 19.080 2019-12 155.900 13,6% 10.046 6,4 47 0,01 0,6 4.004 8,92 17.639 -7.632 10.007 2,15 15.915 2020-12 127.144 11,3% 4.199 3,3 -1.279 -0,32 0,15 3.973 8,09 24.269 -5.742 18.527 4,03 19.552 Price/Earnings Price/Book 2016-12 N/A N/A 2017-12 11,35 1,52 2018-12 4,94 0,85 2019-12 2020-12 23,25 N/A 1,04 1,09 Current 15,35 1,5 2016-12 100 83,39 16,61 8,03 2017-12 100 83,77 16,23 7,35 2018-12 100 84,99 15,01 7,11 2019-12 100 86,4 13,6 7,16 2020-12 100 88,68 11,32 8,02 Margins % of Sales Revenue COGS Gross Margin SG&A R&D Other Operating Margin Net Int Inc & Other EBT Margin 8,58 4,1 4,48 8,88 -3,68 5,2 7,9 -5,19 2,71 6,44 6,85 -0,41 3,3 4,18 -0,88 Net Margin % Asset Turnover (Average) Return on Assets % Financial Leverage (Average) Return on Equity % Return on invested Capital % Interest Coverage 2016-12 2017-12 2018-12 2019-12 2020-12 3,03% 4,85% 2,29% 0,03% -1,01% 0,66 0,63 0,62 0,61 0,48 1,93% 2,95% 1,43% 0,02% -0,48% 8,16 7,39 7,14 7,79 8,71 15,9 23,73 10,38 0,14 4 6,62 9,27 6,42 3,76 3,07 1,69 1,8 1,41 0,94 0,89 Current Ratio Quick Ratio Financial Leverage Debt/Equity Debt/Asset 2016-12 1,201 1,07 8,16 3,2 0,8774 2017-12 1,225 1,08 7,39 2,94 0,8647 2018-12 1,200 1,04 7,14 2,8 0,8599 2019-12 1,162 0,99 7,79 3,08 0,8716 2020-12 1,201 1,05 8,71 3,63 0,8852 Days Sales Outstanding Days Inventory Payables Period Cash Conversion Cycle Receivables Turnover Inventory Turnover Fixed Assets Turnover Asset Turnover 2016-12 191,10 24,83 59,93 156,46 1,91 14,7 4,88 0,66 2017-12 139,90 26,65 61,95 104,6 2,61 13,7 4,65 0,63 2016-13 146,10 28,79 60 114,89 2,50 12,7 4,48 0,62 2017-13 150,35 29,82 57,17 123 2,43 12,2 4,29 0,61 2020-12 165,47 34,95 69,4 131,02 2,21 10,4 3,46 0,48Step by Step Solution
There are 3 Steps involved in it
Step: 1

Get Instant Access to Expert-Tailored Solutions
See step-by-step solutions with expert insights and AI powered tools for academic success
Step: 2

Step: 3
Ace Your Homework with AI
Get the answers you need in no time with our AI-driven, step-by-step assistance
Get Started
Accounting And Auditing Research Tools And Strategies
Authors: Thomas R. Weirich, Thomas C. Pearson, Natalie Tatiana Churyk
10th Edition
1119698138, 9781119698135