Answered step by step
Verified Expert Solution
Link Copied!

Question

1 Approved Answer

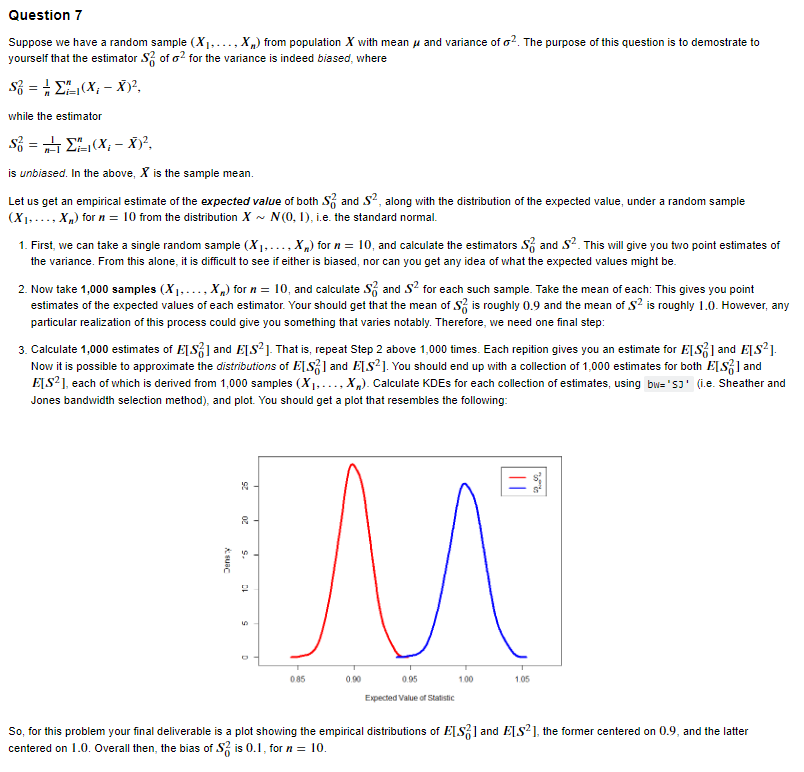
Using ggplot2 in R Suppose we have a random sample (X1,,Xn) from population X with mean and variance of 2. The purpose of this question

Using ggplot2 in R

image text in transcribed

Suppose we have a random sample (X1,,Xn) from population X with mean and variance of 2. The purpose of this question is to demostrate to yourself that the estimator S02 of 2 for the variance is indeed biased, where S02=n1i=1n(XiX)2 while the estimator S02=n11i=1n(XiX)2, is unbiased. In the above, X is the sample mean. Let us get an empirical estimate of the expected value of both S02 and S2, along with the distribution of the expected value, under a random sample (X1,,Xn) for n=10 from the distribution XN(0,1), i.e. the standard normal. 1. First, we can take a single random sample (X1,,Xn) for n=10, and calculate the estimators S02 and S2. This will give you two point estimates of the variance. From this alone, it is difficult to see if either is biased, nor can you get any idea of what the expected values might be. 2. Now take 1,000 samples (X1,,Xn) for n=10, and calculate S02 and S2 for each such sample. Take the mean of each: This gives you point estimates of the expected values of each estimator. Your should get that the mean of S02 is roughly 0.9 and the mean of S2 is roughly 1.0. However, ar particular realization of this process could give you something that varies notably. Therefore, we need one final step: 3. Calculate 1,000 estimates of E[S02] and E[S2]. That is, repeat Step 2 above 1,000 times. Each repition gives you an estimate for E[S02] and E[S2]. Now it is possible to approximate the distributions of E[S02] and E[S2]. You should end up with a collection of 1,000 estimates for both E[S02] and E[S2], each of which is derived from 1,000 samples (X1,,Xn ). Calculate KDEs for each collection of estimates, using (i.e. Sheather an Jones bandwidth selection method), and plot. You should get a plot that resembles the following: So, for this problem your final deliverable is a plot showing the empirical distributions of E[S02] and E[S2], the former centered on 0.9, and the latter centered on 1.0. Overall then, the bias of S02 is 0.1, for n=10

Step by Step Solution

There are 3 Steps involved in it

Step: 1

blur-text-image

Get Instant Access to Expert-Tailored Solutions

See step-by-step solutions with expert insights and AI powered tools for academic success

Step: 2

blur-text-image

Step: 3

blur-text-image

Ace Your Homework with AI

Get the answers you need in no time with our AI-driven, step-by-step assistance

Get Started

Recommended Textbook for

More Books

Students also viewed these Databases questions

Question

an element of formality in the workplace between different levels;

Answered: 1 week ago