Using Matlab

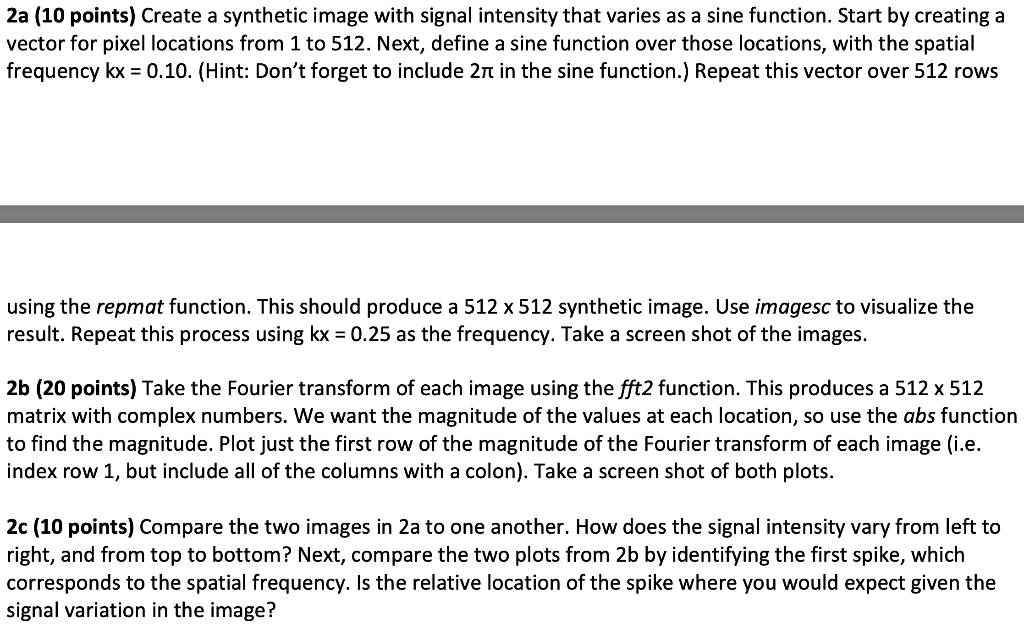
2a (10 points) Create a synthetic image with signal intensity that varies as a sine function. Start by creating a vector for pixel locations from 1 to 512. Next, define a sine function over those locations, with the spatial frequency kx = 0.10. (Hint: Don't forget to include 2n in the sine function.) Repeat this vector over 512 rows using the repmat function. This should produce a 512 x 512 synthetic image. Use imagesc to visualize the result. Repeat this process using kx = 0.25 as the frequency. Take a screen shot of the images. 2b (20 points) Take the Fourier transform of each image using the fft2 function. This produces a 512 x 512 matrix with complex numbers. We want the magnitude of the values at each location, so use the abs function to find the magnitude. Plot just the first row of the magnitude of the Fourier transform of each image (i.e. index row 1, but include all of the columns with a colon). Take a screen shot of both plots. 2c (10 points) Compare the two images in 2a to one another. How does the signal intensity vary from left to right, and from top to bottom? Next, compare the two plots from 2b by identifying the first spike, which corresponds to the spatial frequency. Is the relative location of the spike where you would expect given the signal variation in the image? 2a (10 points) Create a synthetic image with signal intensity that varies as a sine function. Start by creating a vector for pixel locations from 1 to 512. Next, define a sine function over those locations, with the spatial frequency kx = 0.10. (Hint: Don't forget to include 2n in the sine function.) Repeat this vector over 512 rows using the repmat function. This should produce a 512 x 512 synthetic image. Use imagesc to visualize the result. Repeat this process using kx = 0.25 as the frequency. Take a screen shot of the images. 2b (20 points) Take the Fourier transform of each image using the fft2 function. This produces a 512 x 512 matrix with complex numbers. We want the magnitude of the values at each location, so use the abs function to find the magnitude. Plot just the first row of the magnitude of the Fourier transform of each image (i.e. index row 1, but include all of the columns with a colon). Take a screen shot of both plots. 2c (10 points) Compare the two images in 2a to one another. How does the signal intensity vary from left to right, and from top to bottom? Next, compare the two plots from 2b by identifying the first spike, which corresponds to the spatial frequency. Is the relative location of the spike where you would expect given the signal variation in the image


