

Answered step by step
Verified Expert Solution
Question
1 Approved Answer
using matlab 8, A parametric equation is given by 3t 1+1 3t2 1 + t3 x= , y= (Note that the denominator approaches 0 when
using matlab
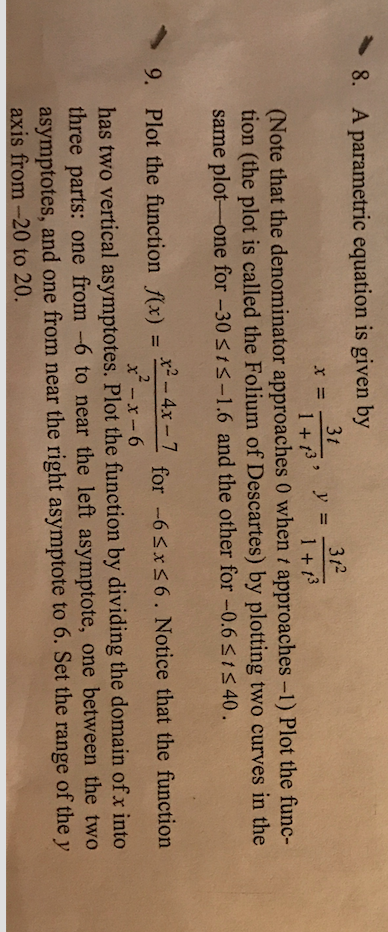
8, A parametric equation is given by 3t 1+1 3t2 1 + t3 x= , y= (Note that the denominator approaches 0 when / approaches-1) Plot the func- tion (the plot is called the Folium of Descartes) by plotting two curves in the same plot-one for -30 sis-1.6 and the other for -0.6s1s40. x2-4-7 x-x-6 9. Plot the function f(x) = for-6 6 . Notice that the function has two vertical asymptotes. Plot the function by dividing the domain of x into three parts: one from -6 to near the left asymptote, one between the two asymptotes, and one from near the right asymptote to 6. Set the range of the y 20 to 20Step by Step Solution
There are 3 Steps involved in it
Step: 1

Get Instant Access to Expert-Tailored Solutions
See step-by-step solutions with expert insights and AI powered tools for academic success
Step: 2

Step: 3
Ace Your Homework with AI
Get the answers you need in no time with our AI-driven, step-by-step assistance
Get Started
Essentials of Database Management
Authors: Jeffrey A. Hoffer, Heikki Topi, Ramesh Venkataraman
1st edition