

Question
Using MatLab. Consider the following set of data points on the xy-plane: (2.1, 2.2), (1.3, 5.1), (0.1, 1), (0.5, 0.1), (1.4, 0.6), (2.0, 1.8). ()
Using MatLab. Consider the following set of data points on the xy-plane: (2.1, 2.2), (1.3, 5.1), (0.1, 1), (0.5, 0.1), (1.4, 0.6), (2.0, 1.8). ()
You will need to find a polynomial of degree at most 5 that passes through these 6 points. (Does this polynomial exist? Is it unique?) Please, complete the following steps:
1.Create two row vectors x and y, containing respectively the x and y coordinates of the data points in ().
Variables: x,y
2.Assuming there exits a degree 5 polynomial which passes through the points in (), write down the system of 6 linear equations representing this information, i.e. each equation in the system shows that one of the (x, y) pairs in () solves a certain degree 5 polynomial. (You dont need to submit this task.)
3.Create a variable holding the coefficient matrix A of the system in Task 2. Do not enter the matrix entries by hand. Instead, initialize a zero matrix of the appropriate dimension using zeros and then fill in the coefficients using a pair of for loops. So your code will look something like this
n = length(x); A = zeros(n,n); for i=1:n
for j=1:n A(i,j) = ...end end
Variables: A
4.If you have completed the previous tasks correctly, you will have generated the coefficient matrix A for your linear system from Task 2. Notice that the constants from the right-hand side are just the entries in the row vector y. Solve the system using Matlabs backslash operator. (Youll need to use y as your constant vector, since y is a row vector.) Name the solution p (a good name for a variable holding polynomial coefficients).
Variables: p
5.At this point, it would be a good idea to compare the values of polyval(p,x) with the vector y to make sure you got the right answer. To do this, add the following commands to your script.
% error check err = max( abs( polyval(p,x) - y ) ); fprintf( max error in polyval = %e , err );Now, when you run your script, Matlab will report the largest absolute difference between the vector y and the vector polyval(p,x). Due to errors introduced internally by rounding, this value will almost certainly not be zero, but it should be a very small number like 4.884981e-15, which is Matlabs representation of the number 4.884981 1015. (This step helps you check your work. There are no required output variables.)
6.Divide the interval [2.1, 2.0] into 100 equal intervals using the linspace command and store it to the variable x1 (x1 should have 101 entries). If you havent worked with linspace before, see if you can figure out what the following commands do: linspace(-1,3,2), linspace(-1,3,3) and linspace(-1,3,11).
Variables: x1
7.Evaluate the polynomial at the points of the array x1 and store the result to the variable y1. Variables: y1
In applications with many data points, polynomial fitting is often not practical for a number of reasons. In those cases, other methods of interpolation are used. There are several methods of interpolation available in Matlab. We will consider the most commonly used linear, cubic (piecewise cubic Hermite interpolation) and (cubic) spline interpolation. Your lab instructor will explain the difference between those three.
Matlabs basic interpolation command is called interp1. Use the command doc interp1 to bring up its documentation and see if you can figure out how to use it. Dont try to read every detail. It can help to scroll down to the examples and see the command in action.
8.Use interp1 to compute the values y2 of the polynomial at the points x1 with linear option. Variables: y2
9.Use interp1 to compute the values y3 of the polynomial at the points x1 with cubic option. Variables: y3
10.Use interp1 to compute the values y4 of the polynomial at the points x1 with spline option. Variables: y4
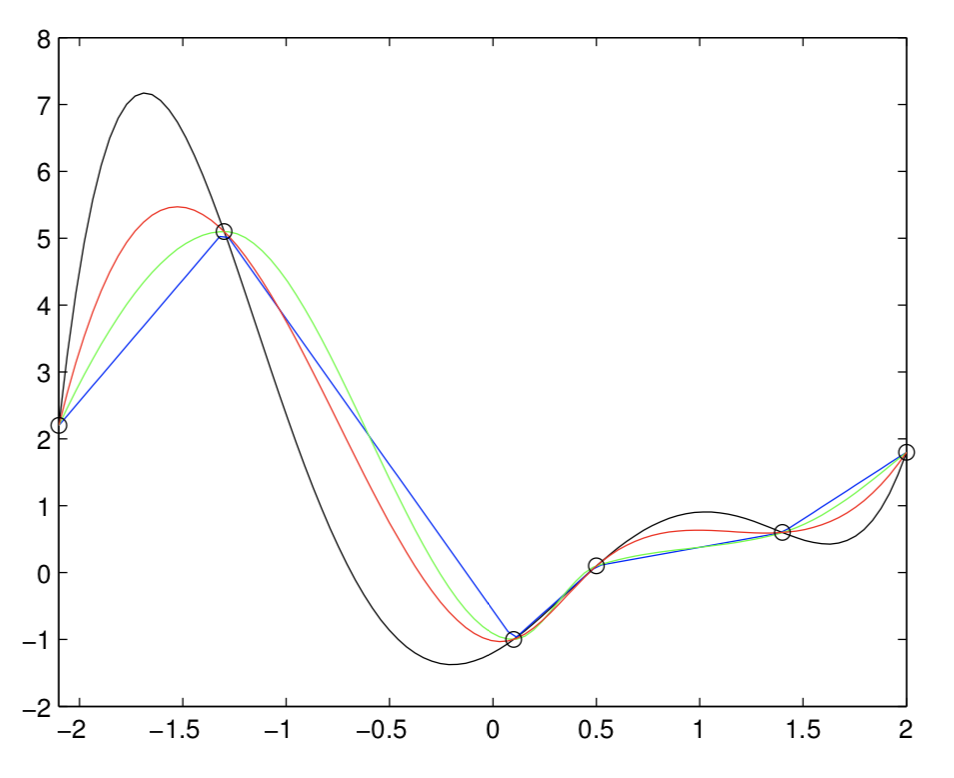
11.Plot y1, y2, y3, y4 as functions of x1 on the same graph using the plot command. Use black color for y1, blue for y2, green for y3 and red for y4. Mark the initial set of points stored in x and y on this graph using black circles. The result should look something like this:
Notice the differences in the results of using the various methods of interpolation.
4 3 1.5 0.5
Step by Step Solution
There are 3 Steps involved in it
Step: 1

Get Instant Access to Expert-Tailored Solutions
See step-by-step solutions with expert insights and AI powered tools for academic success
Step: 2

Step: 3
Ace Your Homework with AI
Get the answers you need in no time with our AI-driven, step-by-step assistance
Get Started
OpenStack Trove
Authors: Amrith Kumar, Douglas Shelley
1st Edition
1484212215, 9781484212219