

Answered step by step
Verified Expert Solution
Question
1 Approved Answer
Using MATLAB do a linear regression analysis. The values of x and their corresponding values of y are shown in the table below. Use MATLAB
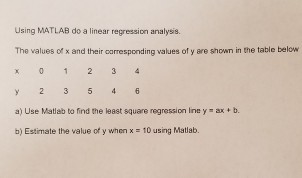
Using MATLAB do a linear regression analysis. The values of x and their corresponding values of y are shown in the table below. Use MATLAB to find the least square regression line y = ax + b. b) Estimate the value of y when x = 10 using MATLAB
Step by Step Solution
There are 3 Steps involved in it
Step: 1

Get Instant Access to Expert-Tailored Solutions
See step-by-step solutions with expert insights and AI powered tools for academic success
Step: 2

Step: 3
Ace Your Homework with AI
Get the answers you need in no time with our AI-driven, step-by-step assistance
Get Started
Excel As Your Database
Authors: Paul Cornell
1st Edition
1590597516, 978-1590597514