

Question: using Matlab In this problem, assume that you have designed a large array of small photovoltaic cells, which are very cheap but fail often. You
 using Matlab
In this problem, assume that you have designed a large array of small photovoltaic cells, which are very cheap but fail often. You need to design a system which can monitor the current received irradiation data and alert if any cells are reporting outside of the range of their surrounding neighbors. The data file provided Problem2.csv. The file will be a matrix of many rows and columns. Each element represents a single PV cell that you will be checking for failures. TASK #1: Load in the data and check that all values in the matrix are less than 1000 and positive. For each value found that is greater than 1000 or negative, ask the user to replace that value with a new value less than 1000 but positive. If a value less than 1000 is not entered or the value is negative, the program should ask again until a value is appropriate. The result should be a matrix with all positive values less than 1000. This must be checked before calculations begin. TASK #2: You will search for any failed PV cells by averaging the value of all cells around the cell of interest and using the percent difference given in the equation below to compare that average with the value of the cell of interest. The user will enter a percent difference threshold which will determine at what level a cell is considered failing. Your code should perform these checks and calculations at each cell keeping in mind the multiple cases described at the bottom of this page with associated diagrams: Average value of all cells around the center cell. Use the percent difference equation below with a as the average value b as the center cell value.
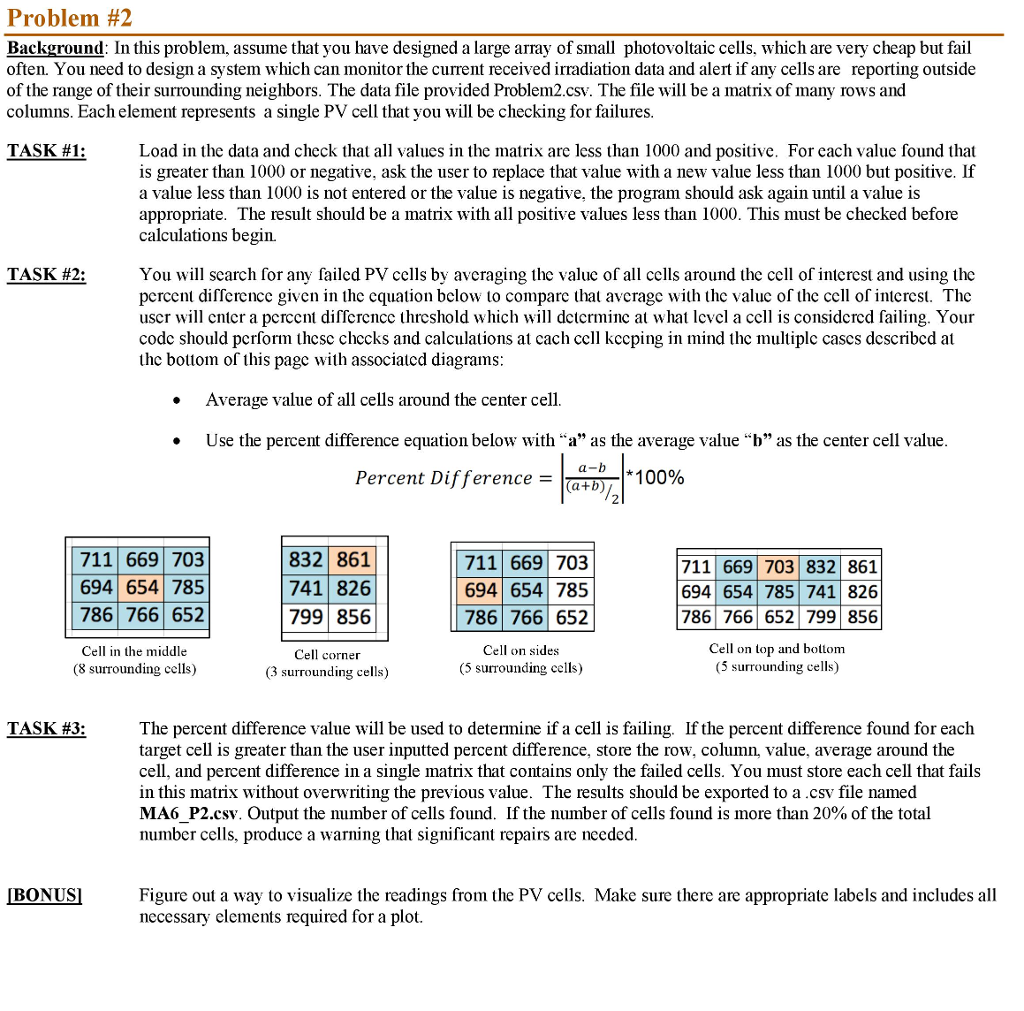
Problem #2 Background: In this problem, assume that you have designed a large array of small photovoltaic cells, which are very cheap but fail often. You need to design a system which can monitor the current received irradiation data and alert if any cells are reporting outside of the range of their surrounding neighbors. The data file provided Problem2.csv. The file will be a matrix of many rows and columns. Each element represents a single PV cell that you will be checking for failures TASK #1: Load in the data and check that all values in the matrix are less than 1000 and positive. For each value found that is greater than 1000 or negative, ask the user to replace that value with a new value less than 1000 but positive. If a value less than 1000 is not entered or the value is negative, the program should ask again until a value is appropriate. The result should be a matrix with all positive values less than 1000. This must be checked before calculations begin. TASK #2: You will search for any failed PV cells by averaging the value of all cells around the cell of interest and using tho percent disserence given in the cquation below to compare that avcragc with the valuc of the cell of intcrest. Thc uscr will cntcr a pcrccnt disfcrencc threshold which will determinc at what lcvel a cell is considcred failing. Your codc should pcrform thesc chccks and calculations at cach ccll kccping in mind thc multiplc cascs dcscribcd at the bottom of this pagc with associated diagrams . Average value of all cells around the center cell Use the percent difference equation below with "a" as the average value "b as the center cell value . Percent Difference = Ta+D 1*100% (a+b) 711 669 703 694 654 785 786 766 652 832 861 741 826 799 856 711 669 703 694 654 785 786 766 652 Cell on sides (5 surrounding cells) 711 669 703 832 861 694 654 785 741 826 786 766 652 799856 Cell on top and bottom (5 surrounding cells) Cell in the middle (8 surrounding cells) Cell corner (3 surrounding cells) The percent difference value will be used to determine if a cell is failing. If the percent difference found for each target cell is greater than the user inputted percent difference, store the row, column, value, average around the cell, and percent difference in a single matrix that contains only the failed cells. You must store each cell that fails in this matrix without overwriting the previous value. The results should be exported to a .csv file named MA6.P2.csv. Output the number of cells found. If the number of cells found is more than 20% of the total number cells, produce a warning that significant repairs are needed TASK #3: Figure out a way to visualize the readings from the PV cells. Make sure there are appropriate labels and includes all necessary elements required for a plot. Problem #2 Background: In this problem, assume that you have designed a large array of small photovoltaic cells, which are very cheap but fail often. You need to design a system which can monitor the current received irradiation data and alert if any cells are reporting outside of the range of their surrounding neighbors. The data file provided Problem2.csv. The file will be a matrix of many rows and columns. Each element represents a single PV cell that you will be checking for failures TASK #1: Load in the data and check that all values in the matrix are less than 1000 and positive. For each value found that is greater than 1000 or negative, ask the user to replace that value with a new value less than 1000 but positive. If a value less than 1000 is not entered or the value is negative, the program should ask again until a value is appropriate. The result should be a matrix with all positive values less than 1000. This must be checked before calculations begin. TASK #2: You will search for any failed PV cells by averaging the value of all cells around the cell of interest and using tho percent disserence given in the cquation below to compare that avcragc with the valuc of the cell of intcrest. Thc uscr will cntcr a pcrccnt disfcrencc threshold which will determinc at what lcvel a cell is considcred failing. Your codc should pcrform thesc chccks and calculations at cach ccll kccping in mind thc multiplc cascs dcscribcd at the bottom of this pagc with associated diagrams . Average value of all cells around the center cell Use the percent difference equation below with "a" as the average value "b as the center cell value . Percent Difference = Ta+D 1*100% (a+b) 711 669 703 694 654 785 786 766 652 832 861 741 826 799 856 711 669 703 694 654 785 786 766 652 Cell on sides (5 surrounding cells) 711 669 703 832 861 694 654 785 741 826 786 766 652 799856 Cell on top and bottom (5 surrounding cells) Cell in the middle (8 surrounding cells) Cell corner (3 surrounding cells) The percent difference value will be used to determine if a cell is failing. If the percent difference found for each target cell is greater than the user inputted percent difference, store the row, column, value, average around the cell, and percent difference in a single matrix that contains only the failed cells. You must store each cell that fails in this matrix without overwriting the previous value. The results should be exported to a .csv file named MA6.P2.csv. Output the number of cells found. If the number of cells found is more than 20% of the total number cells, produce a warning that significant repairs are needed TASK #3: Figure out a way to visualize the readings from the PV cells. Make sure there are appropriate labels and includes all necessary elements required for a plot
Step by Step Solution
There are 3 Steps involved in it

Get step-by-step solutions from verified subject matter experts