

Question
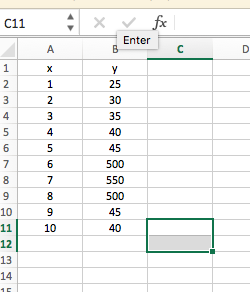
Using Matlab Read in the given excel file and add two to every other y value. If the value of the new y value is
Using Matlab
Read in the given excel file and add two to every other y value. If the value of the new y value is above 50, set it to 50.
Plot the x column values against the new y column values.
Remember the x axis and y axis should be labeled. There needs to be a title on the graph as well
y 25 30 35 40 45 500 $50 500 45 40 9 x-23456789 10 123456789 y 25 30 35 40 45 500 $50 500 45 40 9 x-23456789 10 123456789
Step by Step Solution
There are 3 Steps involved in it
Step: 1

Get Instant Access to Expert-Tailored Solutions
See step-by-step solutions with expert insights and AI powered tools for academic success
Step: 2

Step: 3
Ace Your Homework with AI
Get the answers you need in no time with our AI-driven, step-by-step assistance
Get Started
SQL Antipatterns Avoiding The Pitfalls Of Database Programming
Authors: Bill Karwin
1st Edition
1680508989, 978-1680508987