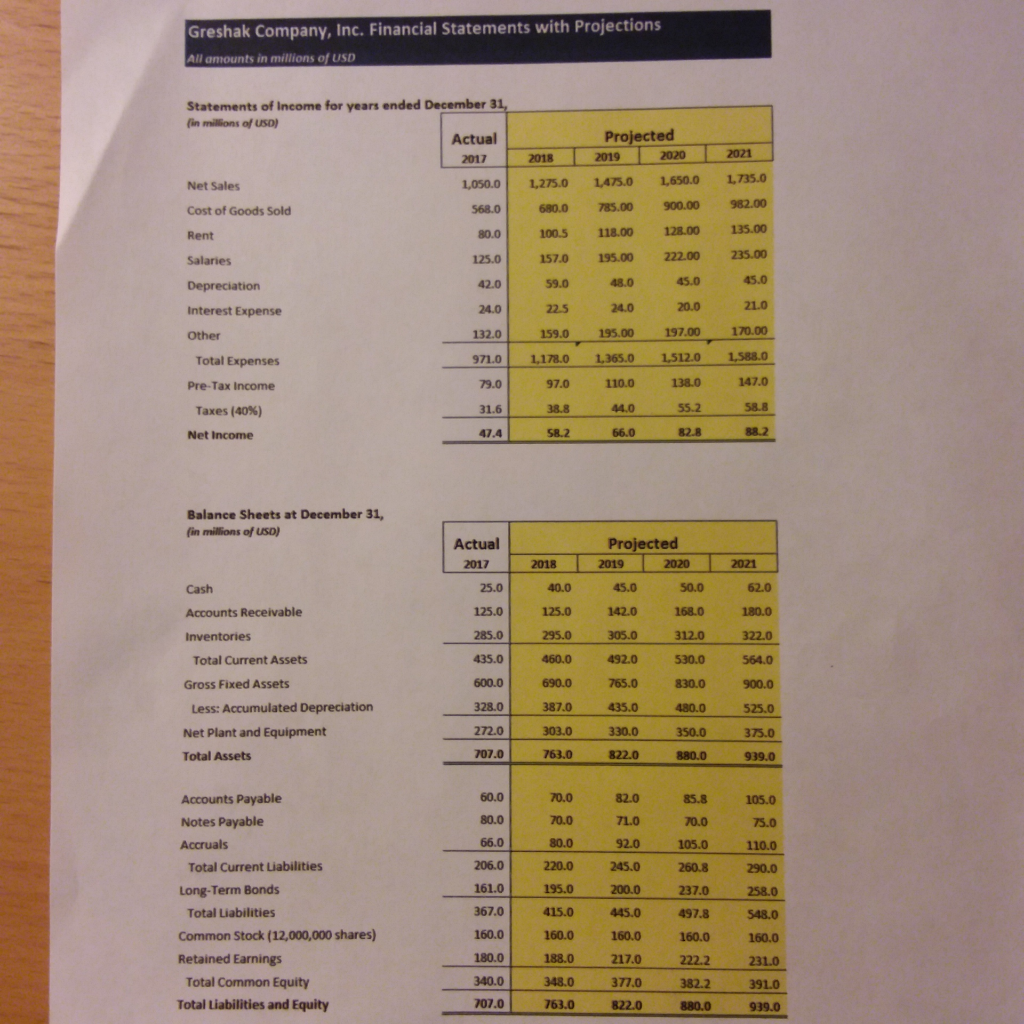
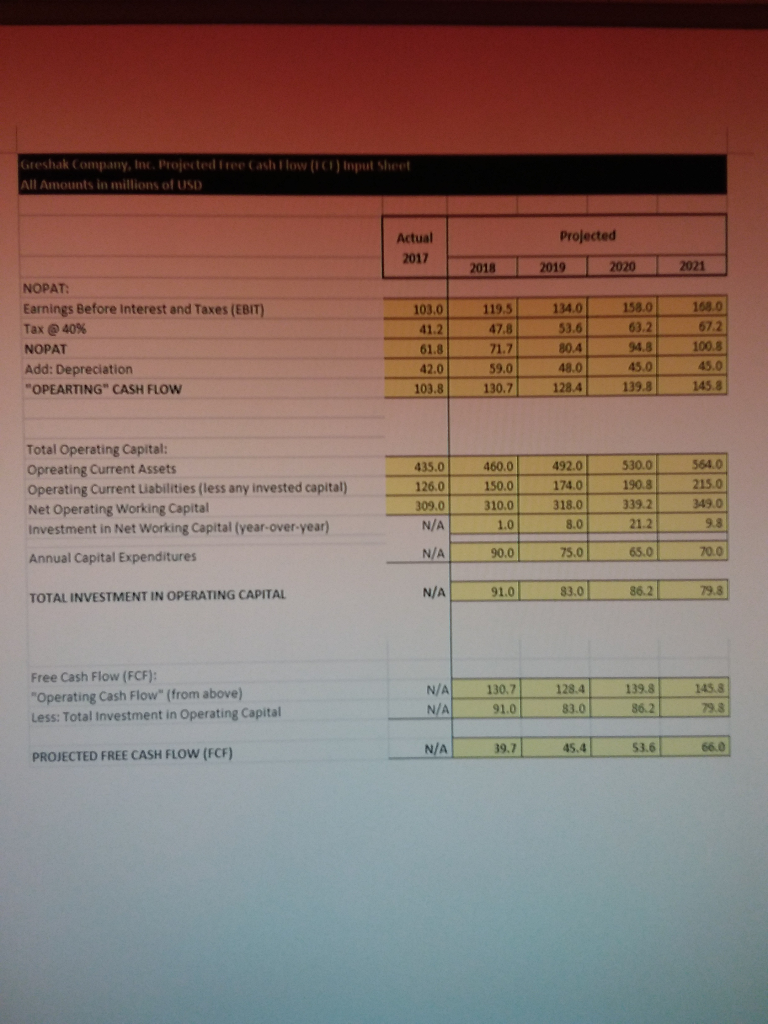
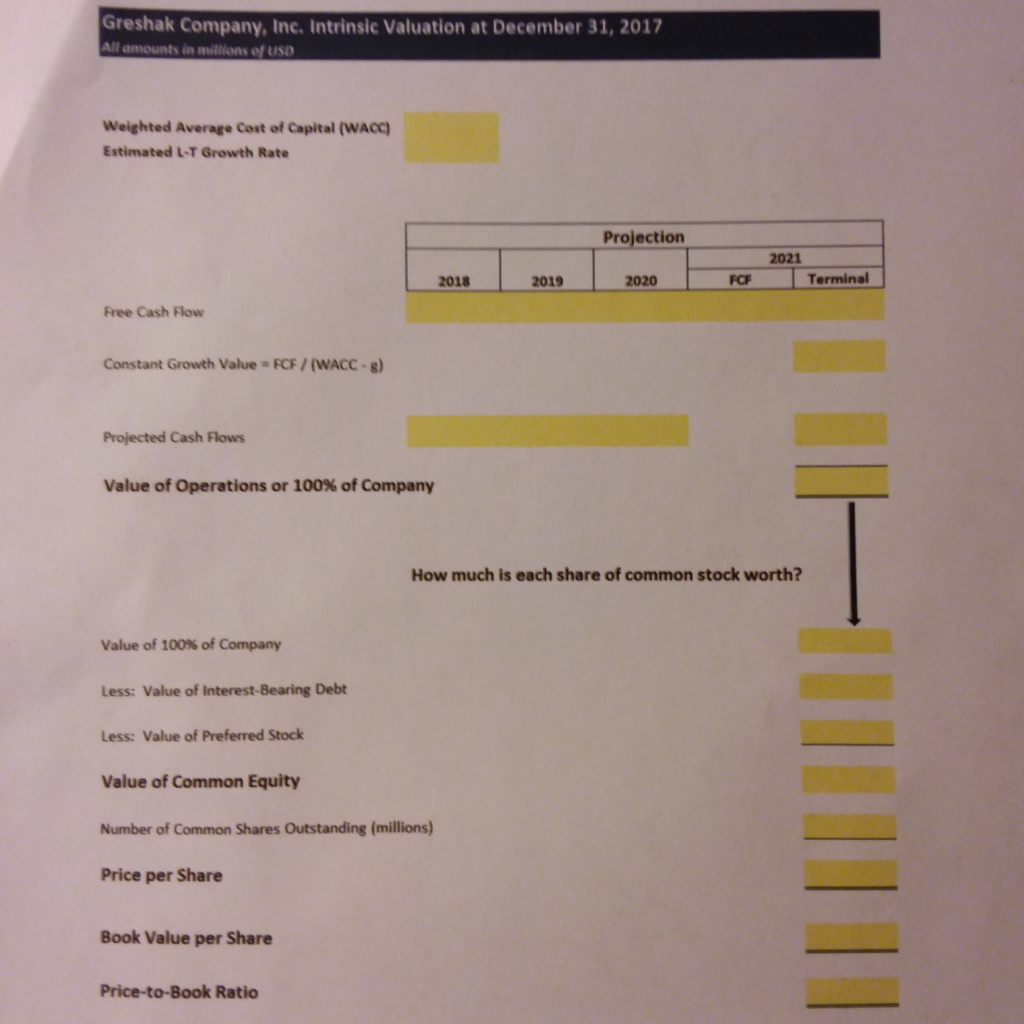
Using MS-Excel and the template on the following pages, calculate the Intrinsic Value of Greshaks operations (i.e., the estimated value of the company) using the data above (hint see Free Cash Flow methodology).


Greshak Company, Inc. Financial Statements with Projections All amounts in millions of USD Statements of Income for years ended December 31 in millions of USD) Actual Projected Net Sales Cost of Goods Sold Rent Salaries Depreciation Interest Expense 1,050.0 1,275.0 1475.0 1,650.0 1,735. 568.0 680.0 785.00 900.00 982.00 80.0 100.5 118.00 128.00 135.00 125.0 157.0 195.00 222.00 235.00 42.0 59.0 48.0 45.0 45.0 24.0 225 24.0 20.0 21.0 159.0 195.00 197.00 170.00 971. 1,1780 1.365.0 1,512.0 1,588.0 147.0 132.0 Total Expenses Pre-Tax Income 79.0 Taxes (40%) Net Income Balance Sheets at December 31, in millions of USD) Projected 2019 2020 Actual 2017 25.040.0 45.0 50.0 62.0 125.0 1250 142.0 168.0 1. Accounts Receivable 285.0 295.0 4835.0 800 920 53003640 Total Current Assets 600.0 690.0765.0 830.0 900.0 525.0 375.0 Gross Fixed Assets Less: Accumulated Depreciation Net Plant and Equipment Total Assets 328.0 387.0 303.0 763.0 435.0 480.0 272.0 330.0 939.0 Accounts Payable Notes Payable 60.070.082.0 85.8105.0 80.0 70.0 71O 70.0 75.0 80.0 105.0 110.0 206.0 220.0 245.0 0.3 290. Total Current Liabilities Long-Term Bonds 161.0 195.0 200.0 237.0 367.0 415.0 445.0 497.8 548.0 Total Liabilities Common Stock (12,000,000 shares) Retained Earnings 180.0 160.0 150.0 160.0 160.0 180.0 340.0 07.0 188.0 348.0 763.0822.0 217.0 231.0 Total Common Equity Total Liabilities and Equity 377.0 382.2 391.0 880.0 Greshak Company, Inc. Projected Free Cash low (C) oput Shee All Amounts in millions of USD Projected Actual 2017 2018 I 2019 I 2020 2021 NOPAT Earnings Before Interest and Taxes (EBIT Tax @ 40% NOPAT Add: Depreciation OPEARTING CASH FLOW 158.0 63.2 94.8 45.0 139.8 168.0 67.2 100.8 45.0 145.8 103.0 119.5 134.0 412 47.0 .62 672 61.8 42.0 103.8 71.7 59.0 130.7 80.4 48.0 128.4 Total Operating Capital Opreating Current Assets Operating Current Liabilities (less any invested capital) Net Operating Working Capital Investment in Net Working Capital (year-over-year) Annual Capital Expenditures 564.0 215.0 349.0 9.8 435.0 126.0 309.0 N/A 460.0 150.0 310.0 492.0 174.0 318.0 530.0 190.8 339.2 21.2 1.0 8.0 N/A | 90.0 | 75.0 | 65.0 | 20.0 N/A 91.0 83.0 86.2 79.3 TOTAL INVESTMENT IN OPERATING CAPITAL Free Cash Flow (FCF): "Operating Cash Flow" (from above) Less: Total Investment in Operating Capital N/A130.7128.4 139.81458 NA 91.0 | 83.0 | 86.2 | 79.8 N/A 39.7 45.4 53.6 66.0 PROJECTED FREE CASH FLow (FCF) Greshak Company, Inc. Intrinsic Valuation at December 31, 2017 All amounts in millions of US0 Weighted Average Cost of Capital (WACC) Estimated L-T Growth Rate Projection 2021 2018 2020 FCF Terminal 2019 Free Cash Flow Constant Growth Value FCF/(WACC- Projected Cash Flows Value of Operations or 100% of Company How much is each share of common stock worth? value of 100% of Company Less: Value of Interest-Bearing Debt Less: Value of Preferred Stock Value of Common Equity Number of Common Shares Outstanding (millions) Price per Share Book Value per Share Price-to-Book Ratio


