Using Python3 plz! Thanks!

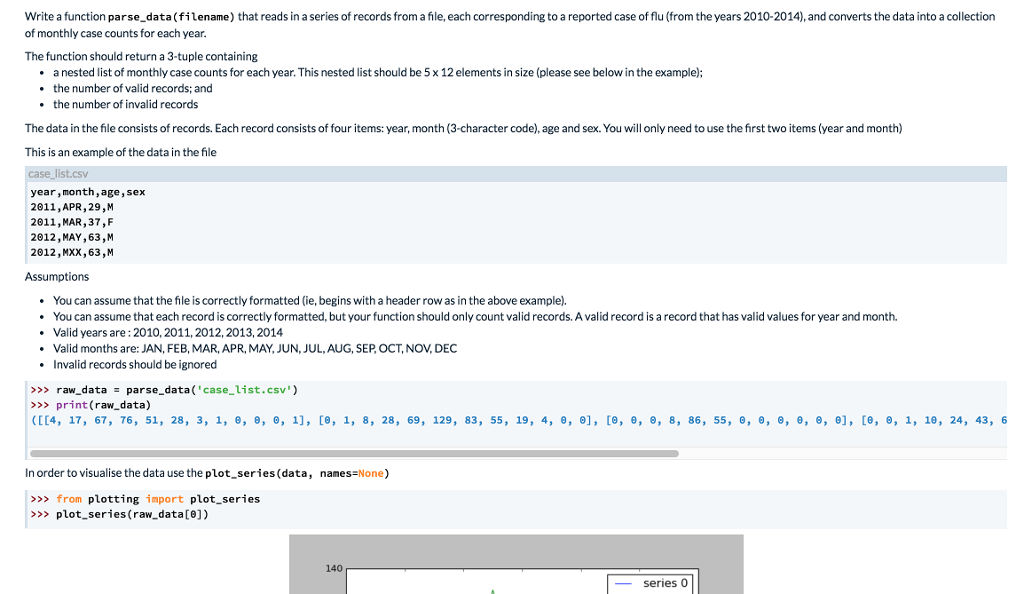
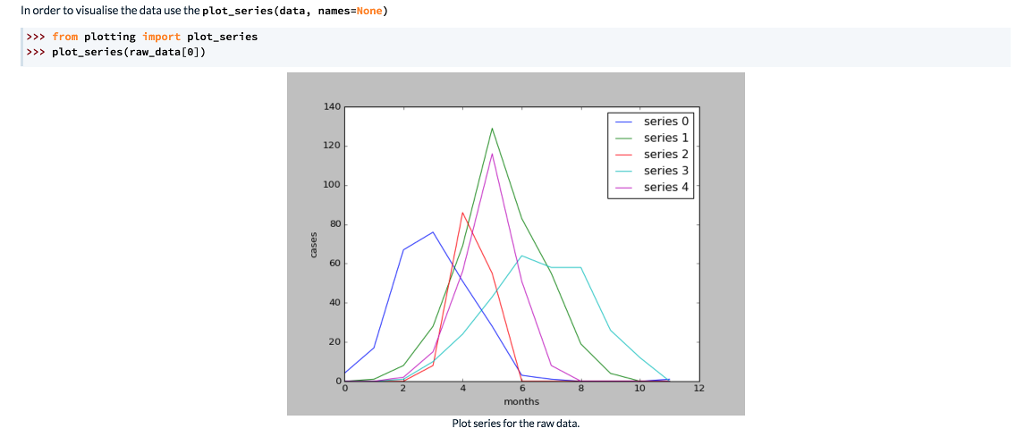
Write a function parse data(filename) that reads in a series of records from a file, each corresponding to a reported case offlu (from the years 2010-2014), and converts the data into a collection of monthly case counts for each year. The function should return a 3-tuple containing . . . a nested list of monthly case counts for each year. This nested list should be 5 x 12 elements in size (please see below in the example); the number of valid records; and the number of invalid records The data in the file consists of records. Each record consists of four items: year, month (3-character code), age and sex. You will only need to use the first two items (year and month) This is an example of the data in the file year,month,age, sex 2011,APR,29,M 2011,MAR, 37,F 2012,MAY,63,M 2012,MXX,63,M Assumptions . You can assume that the file is correctly formatted (ie, begins with a header row as in the above example). . You can assume that each record is correctly formatted, but your function should only count valid records. A valid record is a record that has valid values for year and month. Valid years are: 2010, 2011, 2012,2013, 2014 Valid months are: JAN, FEB, MAR, APR, MAY, JUN, JUL, AUG, SEP, OCT, NOV, DEC Invalid records should be ignored . >>> raw-data = parse-data( 'case-list.csv.) >>> print (raw_data) ([[4, 17, 67, 76, 51, 28, 3, 1, , , , 1], [e, 1, 8, 28, 69, 129, 83, 55, 19, 4, , ], [e, , , 8, 86, 55, , , e, e, e, 0], [e, , 1, 10, 24, 43, 6 In order to visualise the data use the plot series (data, names None) >>> >>> from plotting import plot_series plot-series(raw-data [0]) 140 series O Write a function parse data(filename) that reads in a series of records from a file, each corresponding to a reported case offlu (from the years 2010-2014), and converts the data into a collection of monthly case counts for each year. The function should return a 3-tuple containing . . . a nested list of monthly case counts for each year. This nested list should be 5 x 12 elements in size (please see below in the example); the number of valid records; and the number of invalid records The data in the file consists of records. Each record consists of four items: year, month (3-character code), age and sex. You will only need to use the first two items (year and month) This is an example of the data in the file year,month,age, sex 2011,APR,29,M 2011,MAR, 37,F 2012,MAY,63,M 2012,MXX,63,M Assumptions . You can assume that the file is correctly formatted (ie, begins with a header row as in the above example). . You can assume that each record is correctly formatted, but your function should only count valid records. A valid record is a record that has valid values for year and month. Valid years are: 2010, 2011, 2012,2013, 2014 Valid months are: JAN, FEB, MAR, APR, MAY, JUN, JUL, AUG, SEP, OCT, NOV, DEC Invalid records should be ignored . >>> raw-data = parse-data( 'case-list.csv.) >>> print (raw_data) ([[4, 17, 67, 76, 51, 28, 3, 1, , , , 1], [e, 1, 8, 28, 69, 129, 83, 55, 19, 4, , ], [e, , , 8, 86, 55, , , e, e, e, 0], [e, , 1, 10, 24, 43, 6 In order to visualise the data use the plot series (data, names None) >>> >>> from plotting import plot_series plot-series(raw-data [0]) 140 series O


