

Question
USING R STUDIO Using the NBA data points Analysis and provide charts or diagram (ggplot or others) to find out which NBA player 1) Is
USING R STUDIO
Using the NBA data points
Analysis and provide charts or diagram (ggplot or others) to find out which NBA player
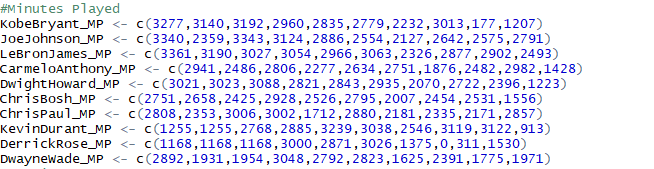
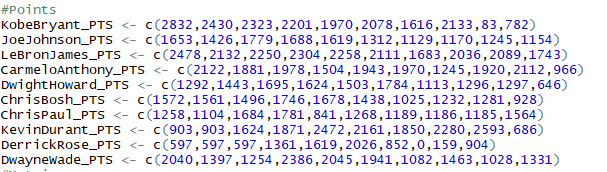
1) Is the most efficient player?(hint: points vs. minutes played)
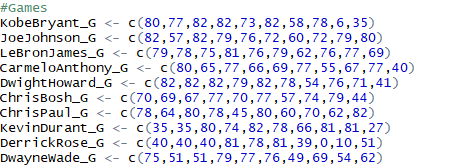
2) Is the 'best value" player (hint: in terms of productivity vs. salary paid).
Use plotting functions and charts to support your position. Or create your own data point from the original data set.
You need to submit your code, your chart (screenshot) and your answers to the above two questions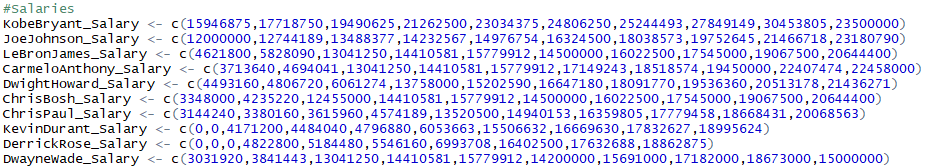
Step by Step Solution
There are 3 Steps involved in it
Step: 1

Get Instant Access to Expert-Tailored Solutions
See step-by-step solutions with expert insights and AI powered tools for academic success
Step: 2

Step: 3
Ace Your Homework with AI
Get the answers you need in no time with our AI-driven, step-by-step assistance
Get Started
Databases In Networked Information Systems Second International Workshop Dnis 2002 Aizu Japan December 18 2002 Proceeding Lncs 2544
Authors: Subash Bhalla
1st Edition
3540002642, 978-3540002642